Exchange: | NASDAQ |
Market Cap: | 90.132B |
Shares Outstanding: | 1.287B |
Sector: | Technology | |||||
Industry: | Semiconductors | |||||
CEO: | Mr. Timothy M. Archer | |||||
Full Time Employees: | 17200 | |||||
Address: |
|
|||||
Website: | https://www.lamresearch.com |
Click to read more…
Operator: Good evening, and welcome to the Lam Research June Quarterly Earnings Call. All participants will be in a listen-only mode. [Operator Instructions] After today’s presentation there will be an opportunity to ask questions. [Operator Instructions] Please note, this call is being recorded. I would now like to turn the conference over to Mr. Ram Ganesh, VP Investor Relations. Please go ahead.
Ram Ganesh: Thank you, and good afternoon, everyone. Welcome to the Lam Research Quarterly Earnings Conference Call. With me today are Tim Archer, President and Chief Executive Officer; and Doug Bettinger, Executive Vice President and Chief Financial Officer. During today's call, we will share our overview on the business environment, and we'll review our financial results for the June 2024 quarter and our outlook for the September 2024 quarter. The press release detailing our financial results was distributed a little after 1:00 p.m. Pacific Time. The release can also be found on the Investor Relations section of the company's website along with the presentation slides that accompany today's call. Today's presentation and Q&A include forward-looking statements that are subject to risks and uncertainties reflected in the risk factors disclosed in our SEC public filings. Please see accompanying slides in the presentation for additional information. Today's discussion of our financial results will be presented on a non-GAAP financial basis, unless otherwise specified. A detailed reconciliation between GAAP and non-GAAP results can be found in the accompanying slides in the presentation. This call is scheduled to last until 3:00 p.m. Pacific Time. A replay of this call will be made available later this afternoon on our website. And with that, I'll hand the call over to Tim.
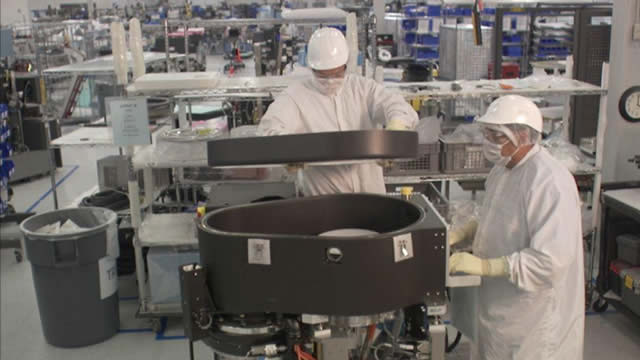
Timothy Archer: Thanks, Rob, and good afternoon, everyone. In the June quarter, Lam delivered another set of solid results with revenues, profitability and earnings per share, all coming in above the midpoint of our guidance. Our CSBG business posted strong growth with revenues up 22% sequentially, led by Reliant and spares. On the manufacturing side, we achieved a key milestone in the quarter with our Malaysia factory shipping its 5,000th chamber. This is the fastest ramp of a new manufacturing facility in Lam's history, and we remain on track to achieve our long-term cost reduction goals through an expanded global manufacturing and supply chain footprint. As previously communicated, 2024 is a year of strategic investment for Lam, where we are prioritizing product development for key technology inflections, global R&D infrastructure close to our customers and digital transformation for operational efficiency at scale. We believe these investments will put Lam in a position to outperform as the industry moves into a period of multiyear WFE spending expansion. Now turning to WFE, we expect this year's spending to be in the mid $90 billion range. Our customer investment profile is generally unchanged from our prior view, apart from slightly stronger domestic China spending and additional demand related to the ramp of high-bandwidth memory or HBM capacity. We see foundry logic, DRAM and NAND investments all up on a year-on-year basis. Global spending on mature node technologies is expected to be roughly flat year-on-year. Looking ahead to 2025, we see a positive environment for continued growth in WFE spending. The power of AI is a transformative business tool is still yet to be fully realized. Today, the focus on AI model training is driving strong demand for GPUs and HBM. However, as AI use cases expand, we believe inferencing at the etch will spur content growth of low-power DRAM and NAND storage in enterprise PCs and smartphones. Investments for AI-enabled etch devices play particularly well to Lam's strengths. We anticipate that memory customers looking to scale capacity and lower bid cost will bias WFE spending toward technology upgrades of the installed base. For NAND, the etch and deposition intensity of upgrades is significantly higher than in a greenfield investment. When you consider Lam's sizable installed base in memory, including roughly 7,500 high aspect ratio dielectric etch chambers for NAND alone, we are positioned to outgrow overall WFE when customers upgrade existing memory production lines to next-generation nodes. Longer term, etch and deposition are set to play an increasingly vital role in the industry's efforts to develop faster, more power efficient and lower-cost semiconductors to serve AI-related applications by delivering critical solutions for atomic level device scaling, new materials innovation and advanced packaging integration, we see tremendous opportunity for Lam to expand our served market and increase our share at each successive process technology node. To this end, our R&D focus is yielding exciting new products, including this year, our first direct power coupled conductor etch tool with matchless power source and bias, known as DIRECTDRIVE. This new power source uses solid-state drivers to stabilize the plasma in the etch chamber 500 times faster than current industry standards. By combining direct power coupling with Lam's unique plasma pulsing capabilities, our latest conductor etch systems are delivering best-in-class performance for newly emerging 4F2 DRAM applications. In 4F2 devices, the nature of the bit line placement requires precise etching of ultra-small high aspect ratio silicon structures to avoid device shorts or leakage. With direct power coupling and plasma pulsing, Lam connects to vertically oriented 4F2 transistor architectures with unprecedented depth uniformity and profile controller. Similarly, conductor etch is becoming a critical enabler for EUV patterning for gate-all-around and DRAM due to the need to reduce etch placement error. For nodes below 2 nanometers, the requirement is for roughly 40% tighter control than at 5 nanometers. Our new conductor etch tool delivers a 30% reduction in feature roughness, which is one of the main contributors to etch placement error. In addition, we can achieve one to two orders of magnitude improvement in defectivity for a given EUV dose, further helping customers reduce the overall cost and improve the capability of the EUV patterning process. Turning to NAND. AI applications are driving demand for faster, higher-capacity enterprise SSDs. NAND makers are pursuing both vertical and lateral scaling of NAND arrays as well as increasing bits stored per sell through implementation of QLC and PLC technologies. In support of these efforts, Lam is developing new dielectric etch and deposition capabilities. Earlier today, we announced Lam Cryo 3.0, Lam's third generation of cryogenic etch technology. Building on our learning from nearly 1,000 cryogenic etch chambers, running in NAND fabs worldwide. This new patented cryogenic etch process delivers industry-leading control of the NAND memory channel hole profile. When a Lam Cryo 3.0 is deployed on our Vantex system, the etch are delivering the industry's highest available ion energy, we can create a 10-micron deep channel hole that has a top-to-bottom profile deviation of less than 10 nanometers or less than 0.1% relative to its depth. Such tight profile control allows customers to increase bit density by packing more cells per layer, while also having the flexibility to add more layers per tier. Lam Cryo 3.0 also addresses our industry's need for more sustainable solutions, delivering a 40% reduction in energy consumption per wafer and a 90% reduction in greenhouse gas emissions per wafer compared to non-cryogenic etchers. Deposition technology is also advancing quickly to support increased bit density and lower cost through multi-tier stacking. Polysilicon and tungsten gap fill materials have typically been used to enable tier stacking in high layer count NAND. Integration of these materials, however, has resulted in poor control of critical dimensions and overlay, negatively impacting yield and performance. Lam's innovative PECVD-based pure carbon and gap fill process provides an attractive alternative material. With the unique combination of high etch selectivity, superior mechanical properties and simplified dry post process removability, it also reduces the number of process steps required in some cases by approximately 50% compared to traditional approaches. Overall, etch and deposition are becoming increasingly critical to addressing the complex semiconductor requirements of a growing AI environment. We are excited by the breadth of opportunities we see ahead for the company, especially those created by technology inflections to gate all around backside power delivery, advanced packaging and [indiscernible] processing. All of these are etch and deposition intensive and each represents a $1 billion or higher growth opportunity for Lam. We look forward to sharing our progress on these fronts as well as our long-term financial model at our next Investor Day, which we are planning to hold in February 2025. With that, I'll turn it over to Doug.
Douglas Bettinger: Great. Thank you, Tim. Good afternoon, everyone, and thank you for joining our call today. We executed well in the June 2024 quarter. Our June quarter results came in above the midpoint or exceeded our guidance ranges for all financial metrics. We were pleased with the company's strong execution. For fiscal year 2024, we achieved the highest gross margin percentage since the merging of Lam with Novellus in 2013, coming in at 48.2% and we generated quite strong free cash flow of approximately $4.3 billion or 29% of revenue. Let's look at the details of our June quarter results. Revenue came in at $3.87 billion, which was an increase from the prior quarter and over the midpoint of guidance. Our deferred revenue balance at the end of the quarter was -- excuse me, $1.55 billion, which is a decrease of $194 million in the March quarter related to revenue recognized that was tied to customer advanced payments. As we sit here today, I believe deferred revenue remains stable at these levels for the foreseeable future. Let's turn to the revenue segment details. June quarter systems revenue in memory was 36%, which was a decrease from the prior quarter level of 44%. The decline in the memory segment was mainly attributable to DRAM. DRAM came in at 19% of systems revenue compared with 23% in the March quarter as investments in mature nodes declined in the June quarter. DRAM revenue reached a new record in fiscal year 2024 with spending focused on DDR5 and HBM enablement as well as on the 1Y node. Non-volatile memory came in at 17% of our systems revenue, which was down from the March quarter level of 21%. And just a reminder, we are characterizing one customer's investment in specialty DRAM as a non-volatile investment since it has a non-volatile component in the device. Net revenue was at a low point for this year, and I expect NAND investment to gradually improve as utilization rates return to more normal levels, our customers slowly increased spending in conversions to 2XX and 3XX layer devices into the next year. The Foundry segment represented 43% of our systems revenue, which was roughly flat with the percentage concentration in the March quarter of 44%. Growth in shipments for gate all around nodes was offset by a decline in mature node spending. The logic and other segment were 21% of system revenue in the June quarter, up from the prior level of 12%. The increase was driven by strength in mature node spending in China. With respect to the regional composition of our total revenue, the China region came in at 39%, down slightly from the prior quarter level of 42% and a little bit higher than our expectations from the previous earnings call. This was driven by domestic China spending. The next largest geographic concentration was Korea at 18% of revenue in the June quarter, versus 24% in the March quarter. Taiwan was 15% of revenue in the June quarter, which was an increase from 9% in the March quarter. The customer support business group revenue in the June quarter pulled approximately $1.7 billion, an increase of 22% from the prior quarter level and 14% higher than the June quarter in calendar 2023. CSBG revenue represented 44% of our June quarter revenues and reached the highest point since the end of calendar 2022, driven primarily by an increase in Reliant systems, followed by growth in spares. Our Reliant systems revenue benefited from strength in domestic China spending for specialty and mature nodes. Spares revenue increased largely due to continued improvement in utilization at our memory customers, as well as a little bit of inventory stocking. I do not think CSBG will grow modestly in calendar year 2024. Let's look at profitability. Our June quarter gross margin came in at 48.5% at the top end of our guided range and slightly down from 48.7% in the March quarter. June quarter gross margin benefited from continued improvement in factory efficiencies, which largely offset the headwind we saw in customer mix that we talked about on the last earnings call. Operating expenses for the June quarter were $689 million, down marginally from the prior quarter amount of $698 million. As Tim mentioned, we continue to prioritize spending in research and development to extend our technology differentiation as well as expand our product portfolio. I'd just point out that more than 70% of our total operating expenses were concentrated in research and development. The June quarter operating margin was 30.7%, above the guidance range mainly because of that strong gross margin performance. Our non-GAAP tax rate for the quarter was 11.5%. We estimate the tax rate for the remainder of the calendar year 2024 to be in the low to mid-teens level, and this rate will fluctuate from quarter-to-quarter. Other income and expense for the June quarter was approximately $19 million in income compared with $10 million in income in the March quarter. The increase in OI&E was primarily the result of fluctuations in the fair value of our venture investments. And as we've talked about in the past, you will see variability in OI&E quarter-to-quarter. Let's turn to the capital return. We allocated approximately $382 million to share repurchases, and we paid $261 million in dividends in the June quarter. During the quarter, we announced that our Board of Directors approved a $10 billion share repurchase authorization. We have $10.8 billion remaining in the plan at the end of the June quarter. For fiscal year 2024, we returned $3.7 billion or 88% of free cash flow, which was in line with our long-term capital plans of returning 75% to 100% of free cash flow. June quarter diluted earnings per share were $8.14, close to the high end of our guidance range. The diluted share count was 131 million shares on track with our expectations and down from the March quarter. Let’s turn to the balance sheet. Cash and cash equivalents totaled $5.9 billion at the end of the June quarter, up a little bit from $5.7 billion at the end of the March quarter. Day sales outstanding were 59 days in the June quarter, a slight increase from 57 days in the March quarter. June quarter inventory turns of 1.9 times compared with 1.8 times in the prior quarter. We are making progress in bringing inventory levels down, and we'll continue to work on this throughout the rest of calendar year 2024. Our noncash expenses for the June quarter included approximately $79 million for equity compensation, $74 million in depreciation and $14 million in amortization. Capital expenditures were $101 million, flat with the March quarter level with spending mainly centered on lab investments in the United States and Asia, as well as manufacturing facilities in Asia, supporting our global strategy to be close to our customers' development and manufacturing locations. We ended the June quarter with approximately 17,200 regular full-time employees, which was flat with the prior quarter. Let's turn to our non-GAAP guidance for the September 2024 quarter. We're expecting revenue of $4.05 billion, plus or minus $300 million. Gross margin of 47%, plus or minus 1 percentage point. This gross margin decline is reflective primarily of an unfavorable quarter-to-quarter change in customer mix. I expect this change to continue to be a slight incremental headwind in the December quarter. Operating margins of 29.5%, plus or minus 1 percentage point. Gross margin and operating margin included impact from ongoing transformation costs related to projects to improve our systems and operations. As we communicated at the beginning of the year, we're focused on reengineering our business processes and systems to drive operational efficiencies and to implement AI at greater scale. And finally, we're forecasting earnings per share of $8 plus or minus $0.75 based on a share count of approximately 131 million shares. Let me wrap up. As we finish the first half of calendar year 2024, I was pleased that we were able to execute to the objectives we shared at the beginning of the year. We prioritize investment to extend our technology differentiation while driving operational improvements. We're encouraged that the spares business recovery is beginning and upgrade activity should improve as we exit the calendar year. Longer term, Lam is well positioned to capitalize the increase in etch and deposition intensity by delivering new capabilities at multiple new manufacturing inflections that we see ahead. We look forward to talking to you in February at our planned Investor Day about the long-term opportunities for Lam to continue our outperformance in the semiconductor industry. Operator, that concludes our prepared remarks. Tim and I would now like to open up the call for questions.
Operator: Thank you. We will now begin the question-and-answer session. [Operator Instructions] Your first question comes from Tim Arcuri with UBS. Please go ahead.
Timothy Arcuri: Thanks a lot. Doug, I wanted to ask about the service system mix in the guidance. So you said that the service -- I thought you said which you now think it's going to grow modestly this year. But if I flatline service in September and December, it's up 8% year-over-year. So can you just clarify what you're thinking for service in the guidance? Thanks.
Douglas Bettinger: Yes, Tim, we don't decompose the individual components of the guide. I was clarifying, we now expect [indiscernible] to be up a little bit for the year. It was particularly strong in the June quarter. Whether it is up, down or sideways from that as we go forward. I'm not going to give you individual components of the forecast. But I do think for the year, it's going to grow a little bit.
Timothy Arcuri: Okay. Great, Doug. Thanks. And then can you talk a little bit about -- just in DRAM, I think there's generally more excitement, Tim, about DRAM WFE among most investors out there about where it could go during this next peak. Obviously, you do very well in NAND. But in DRAM, you did talk about a lot of the investments that you're making. Can you just talk about -- I know your leverage to the advanced packaging part of the HBM dollars being spent but that's still a pretty small piece of it. So can you just maybe give a chance to kind of discuss some of the view that you're not very levered to DRAM and give us a sense of maybe where you're investing and where you think you can gain share in DRAM.
Timothy Archer: Sure. Thanks, Tim. And as you said, we do very well in NAND. We still think NAND day is coming, as I said. We've seen some of that -- those commentaries around the enterprise SSDs, et cetera. But on the DRAM side, the reason we highlighted the progress we're making, especially in this conductor etch. One, it's a new tool we've introduced. It's new capabilities that are very exciting for the industry and really targeted towards the types of ultra small structures that are going to exist in future DRAM nodes going forward. Lam is the global leader in conductor etch. And so we're applying all of that expertise and learning we have towards future DRAM challenges. And I think there's tremendous opportunity for us on those applications, as I pointed out. The other side of it, a lot of the excitement around DRAM is related to HBM. And there, as you commented, we play extremely well with our strong position in both TSV -- etching as well as the TSV electroplating. And I think that we don't see any change in that strong position going forward. So we get the benefit both from the scaling and architectural changes that are occurring in DRAM going forward and from the advanced packaging and HBM related expansion. And all of these -- on both of those sides are multiplied by the fact that you get fewer bits per wafer. And so everybody recognizes you're going to need a lot more DRAM wafers processed going forward. And ultimately, that translates into more equipment from LAM.
Timothy Arcuri: Thank you, Tim.
Timothy Archer: Thanks, Tim.
Operator: Next question comes from Krish Sankar with Cowen & Company. Please go ahead.
Krish Sankar: Hi, thanks for taking question. My first one is for Doug. I think, Doug, you gave some color on China. Kind of curious how to think about China into the back half of this calendar year and into calendar 2025? And along the same path, you kind of mentioned that December quarter, there could be a slight more gross margin headwind. Is there a way to quantify how much that -- how many basis points of headwind would it be in December compared to the 47% in September? And then I have a follow-up for Tim.
Douglas Bettinger: Yes, sure. Krish, I'll just remind you what we said last quarter. It hasn't really changed in this quarter and what that statement was that for the year, 2023-2024, China is up. However, it is a somewhat first half weighted year this year as opposed to last year, it was somewhat second half weighted. I'm not communicating, hey, it's going away. It's not going away. It's just the spending because sometimes these customers are a little bit bigger than a bread box, it can be a little bit lumpy and that's very much what we're seeing in China. I'm not ready to tell you exactly what next year looks like from the China region. But I do think it's going to be a pretty solid year, right? Again, it's not going away. It's too soon for us to quantify things for next year, but 25% should be a pretty decent year in China, Krish.
Krish Sankar: And then, Doug, any color on the December quarter gross margin?
Douglas Bettinger: I'm not going to give you a number, Chris, but I've been signaling for a while that because of customer mix, margin will have a little bit of some headwind going into the second half of the year. I just guided you to 47% in September and suggested that there might be a little bit of incremental headwind into December because of customer mix is what I said in the script.
Krish Sankar: Got it. Got it. Thank you for that Doug. And then, Tim, just a quick follow-up. When I look at all the upcoming tech inflections, like gate all around, backside power delivery, maybe down the road [indiscernible] DRAM. You spoke within that, the transition to 4F2 DRAM from 6F2. I'm kind of curious, is this really that material? And if so, is there a way to size the opportunity for Lam at 4F2. You spoke a little bit about [100 to etch] (ph) just kind of wondering if you can give some more color around how to quantify that number for the 4F2 architecture transition. Thank you.
Timothy Archer: Sure. Well, I don't think we're prepared to quantify it for you today. But I think that -- what my comment was, though, we see each of these inflections. And 6F2 to 4F2 is a technology inflection that brings with it some important changes. I mean, one, the architectural layout of the device itself puts additional requirements on etch, which I think we're very well suited to serve. And that's why we've been developing new conductor etch capabilities to target those new requirements. So there is some incremental opportunity there. Clearly, the jump to 3D NAND is a much bigger step-up in etch depth intensity, but our goal is to increase our SAM and grow our share at every technology node. So we look at whatever is the new requirement and how we can best address that. You also look -- as you look at DRAM going forward, another thing that's happening, whether it's 6F2 or 4F2 is the implementation of more EUV layers and how Lam plays in EUV. Again, anything where effectively pattern transfer etches, the feature sizes are getting smaller, precision is required. These are the kinds of high-tech etches that Lam excels at. And so we look at participating in those. And then on the deposition side, of course, we've talked about things like our dry EUV resist process and how that plays into EUV as DRAM and foundry logic transition from EUV to high-end AUV. And so, we're just looking at every technology node as an opportunity for us to gain.
Krish Sankar: Thank you.
Timothy Archer: Thanks, Krish.
Operator: Your next question comes from Srinivas Pajjuri with Raymond James. Please go ahead.
Srinivas Pajjuri: Thank you. Tim, I have a question on DRAM. Obviously, the recovery has been ongoing and HBM is a secular driver that you talked about, and you do have a very strong position in that market as well. Then I look at your revenue, I think it peaked around December of 2023, and it's been kind of declining on a sequential basis. I'm guessing some of that is maybe mature now DRAM. Just wondering if you're kind of at the bottom and then given all the talk about HBM spending, I would think that it's going to kind of -- it should, at some point, come back strongly. So I just want to hear your thoughts on why it's been declining? And how should we think about, in particular, in DRAM revenue.
Timothy Archer: Yes. I think you generally have it pretty correct. We had talked about the fact that some mature DRAM spending was a little bit heavily concentrated in the second half of last year through early part of this year even. And as that came off, there was some of a reset in what we would call kind of traditional or the conventional DRAM. That is being picked up at some rate by the growth in HBM, but HBM itself is still in its ramping phase. And I think that as we look into 2025 becomes an even bigger driver of wafers in DRAM. And so, I think that explains probably the profile. And I think that as we look forward to the secular driver of HBM, the impact on wafer effectively, how many wafers require us to produce that number of bits due to the dye size and due to the complexity of stacking these DRAMs means that we see DRAM demand for DRAM equipment continuing to grow through 2025 and probably well beyond that.
Srinivas Pajjuri: Okay. Got it. Thank you. And then on the CSBG business being up 20% sequentially, 22%. I know you don't want to give us guidance going forward, at least for the next quarter. I'm just curious about the sustainability of some of the trends that you're seeing, Tim. And then what does that mean for the overall WFE? Is this a prelude to something? And is this just the utilization improving? And then does this usually follow in terms of WFE increasing in terms of new tech migrations or capacity additions. So any color on that would be helpful.
Timothy Archer: Sure. It's a good question. And I guess, again, reminding people that the CSBG business includes our Reliant business, which sells into mature nodes. It includes spares, it includes upgrades and services. And so each of those components move somewhat differently. And we talked about this quarter, particularly being strong as a result of Reliant and spares. We are starting to see a pickup in utilization in the memory fabs as we've talked about. And I've talked a little bit about the fact that as we look forward, we think that upgrades will begin to become a much more prominent part of our customers' WFE spending as they look to upgrade memory fabs that they really haven't been upgraded in quite some time because of the severe downturn that we've seen in that -- in those markets over the last few years. And so I do think, going forward, you see a little bit more of a balance between those different segments. Upgrades coming up stronger and spares continuing to grow simply because our installed base itself continues to get bigger. Traditionally, we would have always said that we would expect the CSBG business to grow every single year, and that's simply effective every year we ship more tools, and those tools then require services and spares and basically present new opportunities for Lam to capture revenue from those systems. So I think long-term, CSBG will be returning back to that growth and next year, probably much more biased towards the upgrades business as customers start to do brand new fab upgrades.
Srinivas Pajjuri: Thanks, Tim.
Operator: Your next question comes from CJ Muse with Cantor Fitzgerald. Please go ahead.
CJ Muse: Yes, good afternoon. Thank you for taking the question. I guess first question I was hoping to focus on gross margins. A couple of quarters ago, Doug, you talked about kind of looking back to the June kind of 2023 quarter as normalized. But given the guide today, it sounds like that was conservative and it's a higher number. So just as you think about calendar 2025, as you get to kind of a normalized China mix and you normalize to Reliant, what would be kind of the base level we should be thinking about for gross margins? And then can you talk to what kind of accretion we should be thinking about related to Malaysia and/or some of these higher-margin upgrade drivers?
Douglas Bettinger: Yes, CJ, I mean, you've alluded to some of the things that move gross margin on, obviously. Yes, I had previously anchored you and other with respect to that June quarter before the China mix improved or strengthened, I guess, maybe not improved. As the baseline -- I guided it down a little bit in September, described customer mix softening a little bit relative to moving that. And I'm not suggesting, hey, a little bit more in December potentially. It's all about customer mix. Too soon for me to guide you for next year, but the things you should be thinking about is what does that customer mix look like next year? I'm not sure yet, and I'm not ready to point you to numbers, but what we will begin to show up in a more significant fashion is the accretion for -- from those Asia factories as we ramp output, that will be a benefit to gross margins. So those are the moving pieces to be thinking about. The customer mix, I'm not entirely sure, but as we see a likely WFE environment next year, that's somewhat stronger, increasingly, the incremental volume will be supported from those Asia factories, which should be beneficial to gross margin CJ.
CJ Muse: Very helpful. And then I guess as my follow-up, in your prepared remarks you spoke to the 7,500 high aspect ratio etch chambers installed in demand industry. And just curious, as you see upgrades there, what kind of growth could that add to overall NAND WFE specifically to you guys? Is there a kind of percentage we should think about? Any help there would be great.
Timothy Archer: We haven't quantified that, but the reason I included it was simply to point out, the installed base itself becomes powerful driver of revenue during those upgrade cycles. And we do think that the next phase, we've seen higher memory fab utilization, particularly when we talked about NAND beginning to improve last quarter, and that seems to be continuing as we move through the remainder of this year. When we get to next year and the upgrades start in earnest, those tools represent opportunities for Lam to help our customers achieve both a technology upgrade and a bit cost reduction as they move forward and accrues quite a lot of revenue for Lam relative to the amount of WFE spend. I remind people, the WFE Lam's capture rate of spending in an upgrade is significantly higher because etch and deposition represents so much of the upgrade. [indiscernible] size of our installed base.
CJ Muse: Thanks so much.
Timothy Archer: Thanks, CJ.
Operator: The next question comes from Stacy Rasgon with Bernstein Research. Please go ahead.
Stacy Rasgon: Hi, guys. Thanks for taking my question. First, I wanted to ask like if the NAND business next year is primarily driven by upgrades, what does that imply for growth? Like would it be conceivable that NAND WFE could double year-over-year in calendar 2025 that was purely upgrade driven? Or would you need capacity additions to get there? And are you seeing any signs at all of capacity additions right now? It doesn't sound like it.
Timothy Archer: Well, Stacy, what I would say is that, obviously, we're not going to guide what NAND WFE is next year. Frankly, I think it's still a developing story. But what we're trying to say is that, as customers move to upgrades, whatever WFE is spent, Lam will be the primary beneficiary of that WFE spend. And so, that's a year in which -- my comment was, we would be confident that we would outgrow WFE in the NAND space if it was primarily upgrade spend. And upgrades represent a tremendous efficient way for customers to essentially advance their technology and lower their costs. And so, we do think that will be the next phase of NAND investment based on our thoughts.
Stacy Rasgon: Got it. Got it. I mean maybe to follow-up on that just a little bit. I mean, if you look at your current like NAND outlook for this year, would you say that, that outlook has gotten better or worse or stayed the same versus like 90 days ago?
Douglas Bettinger: It probably hasn't changed much, Stacy. This is Doug. Maybe a little bit better. We're certainly see a little bit of an uptick in utilization. But I don't think it's meaningfully different, Stacy.
Stacy Rasgon: So got it. So it's kind of a noise.
Douglas Bettinger: Yes, kind of a noise.
Stacy Rasgon: Got it. Okay, that’s helpful. Thank you, guys. Appreciate it.
Operator: The next question comes from Harlan Sur with JPMorgan. Please go ahead.
Harlan Sur: Yes. Good afternoon. Thanks for taking my question. Given the strength in CSBG, it looks like utilization by your customer base continues to rise. Did that also broaden out to start to include not just leading etch logic foundry, DRAM and NAND, but maybe also start to include mature and specialty fabs as well? Or are at a minimum, mature and specialty utilization at least stabilizing in line with some of the cyclical improvements that we're seeing in the semi industry?
Douglas Bettinger: Harlan, maturing that stuff is still pretty soft, frankly. And I think you understand what's going on. If you just listen to everybody else's earnings calls in the analog, industrial, automotive space. There's still a lot of inventory out there, it's still relatively soft. The statements we're making on utilization have more to do with what we're seeing in the memory fabs, quite frankly.
Harlan Sur: I appreciate that. And then on HBM and advanced packaging. I mean last night we heard AMD talk about supply dynamics being tight on their AI GPU supply next year [indiscernible] and HBM. On the custom ASIC front, we hear companies like Broadcom keep getting upside orders from their AI customers like Google. Last quarter, you talked about doing $1 billion in advanced packaging and HBM revenues this year. Has that number moved higher and is the team capacity constrained on advanced packaging systems and are your lead times here for those tools starting to stretch out?
Timothy Archer: Well, it has moved higher, and we're not going to requantify it just yet, but it is -- we're seeing very strong demand in those areas. I talked about the expansion of our global manufacturing supply chain footprint. And obviously, that's giving us more flexibility than we had during the last ramp. Our goal through all those investments was to be able to respond in this next few years of expansion better than we did in the expansion that we saw right around the time of COVID. And so, I think that, that will position us. I’m sure, you're always a little bit short when customers always drop in tools within your lead time, which keeps you busy. But I think that we're doing quite a nice job responding to the urgent request from our customers. We actually like this. I would say that generally from running the business, we like this environment where all parts of our business are a little bit supply constrained. I mean, you hear a lot of our customers talking about being cautious about adding capacity. Other customers talking about having a little trouble getting tools. I think that's a good place for us to be because it means that I think we're setting up for more manageable long-term ramp of demand than sort of a short spike followed by, again, periods of digestion that always creates a little bit of chaos in the industry.
Harlan Sur: Thank you, Tim. Thanks, Doug.
Timothy Archer: Thanks, Harlan.
Operator: Your next question comes from Atif Malik with Citi. Please go ahead.
Atif Malik: Hi. Thank you for taking my question. Doug, if I look at the 2023 year-over-year China sales growth among the big five equipment makers. All of them are up quite well. [indiscernible] is up like 250% and the U.S. peers are up in teens or 20%, but you guys were down 11% total China sales in 2023. And this year, you're expecting China sales to be up. So I'm just trying to understand the dynamics last year. Were this just a function of maybe NAND spending and the NAND project not being active? Or are there competitive elements in China that are working against you?
Timothy Archer: Atif, I'll remind you that perhaps our largest customer got restricted when the regulations came out, our NAND customer in China. That customer was pretty strong in 2022, went away in 2023. So the year-over-year comparisons you're making, you've got to factor that in. And then the strength we're seeing in 2023 to 2024 is a different mix entirely, really not any NAND in China to speak of, at least not domestic China. I don't know if that helps you, but make sure you're thinking about that.
Atif Malik: Yes, it all makes it. That's helpful. And then on the cryo improvement, Tim, that you mentioned, are those improvements or process tool of record is going to solidify your market share next year or the year after?
Timothy Archer: Well, I think that all of these things. When you introduce something new, I mean I think what people kind of lose sight of is. Generally, we're working several years ahead with our customers on R&D. I talked about the investments we're making where we make -- we're building labs close to our customers in different geographies. That's because, in many cases, we're engaging those customers a good five years ahead of production implementation. That's not to say Lam Cryo 3.0 is going to take five years to get into production. But it's not a technology disramping, say, this year, but it really is looking out at the needs of our customers wanted to generations out and really solving their difficult etch challenges. So sometimes when the benefits are so good, and I talked about the fact that we get about 2.5 times etch rate, tremendous profile control, customers will often pull that in sooner. But really, this is designed for kind of the 400-plus layer may ultimately end up being pulled in earlier than that, but that's where you really start to see the needs for this kind of capability.
Atif Malik: Exactly I was asking about it. It is 400 layers or 200 layers, but it sounds like 200 layer.
Timothy Archer: Yes. And I think that what we -- you'll see in our press release today, we talked a little bit about -- we're trying to chart the path across not only etch, but also our deposition films towards where the industry needs to go to get to 1,000 layers, because we truly see over the next decade that that's where you want to get in terms of satisfying bit density and cost as NAND demand continues to expand with AI.
Atif Malik: Great. Thank you.
Timothy Archer: Thank you.
Operator: Next question comes from Toshiya Hari with Goldman Sachs. Please go ahead.
Toshiya Hari: Hi, guys. Thank you so much for taking the questions. I joined late, so I do apologize if these questions have been addressed. Just on the third-generation cryo tool, Tim, that you spoke about. How is this technology or tool fundamentally different or better than your nearest competitor? I know you just spoke to some of the characteristics, but if you can clarify that for us to the extent you're comfortable, that would be really, really helpful. And then my second question, again, on the CSBG side, probably one for Doug. And again, you may have address this. For the full year -- calendar year, I think you previously said flattish, plus or minus. Is that still the view? Or given the strength you saw in June, is that -- should we be thinking about a higher growth rate for the full year? Thank you.
Douglas Bettinger: Maybe I'll take that one first, and then I'll let Tim comment on the 3.0 stuff. Yes, you might have missed my scripted statements. As we sit here today, we now expect that for 2024 CSBG, the word I used was modestly grow this year versus last year. And part of that is, we saw particular strength in the June quarter in Reliant. Little bit of an improvement in spares. And as we think about the utilization trends that are likely occurring with our memory customers, I think spares continues to be decent and we're optimistic that we'll start to see some of the upgrade spend that we've been talking about for a while. And I'll hand it over to Tim on the 3.0 stuff.
Timothy Archer: Sure, Doug. Yes. I think, obviously, what I would just start with is the biggest difference between what we're delivering with Lam Cryo 3.0 and what our competitors do is in the results on the wafer, which we talked about pretty amazing 10-micron deep holes with less than a 10-nanometer paper from the top to bottom. At etch rates that are 2.5 times conventional etching. So it's the results that are pretty amazing. We talked about the fact that the -- this is based on some new surface chemistries that are enabled in our tool -- and there's a whole combination of hardware issue -- hardware configuration and capabilities in our tool that I think allow us to achieve that result. And I can't go into all of those details today, but it is I did allude to one of them, which is on our Vantex system. The chamber design allows us to deliver a significantly higher ion energy than what is available from any other system available in the semiconductor industry. And that does play some role in etching these very, very deep near -- holes with near perfect verticality. So that's about all I can say today. .
Toshiya Hari: Thank you. Appreciate that.
Operator: Your next question comes from Joe Moore with Morgan Stanley. Please go ahead.
Joseph Moore: Great. Thank you. I wanted to ask you, I mean, there's been a number of press concerns about export controls with talking about the foreign direct product rule which doesn't seem like it would affect you, but also talking about entity list. And I'm just wondering, obviously, we don't know what would happen with any of that. But are you seeing any different behavior from your China customers? Are you seeing them push things in or pull things -- push things out because of any of those anxieties.
Timothy Archer: Yes. Joe, I think that obviously, we don't know exactly what's going to happen either just as you said, and so we can't really speculate on that. I have mentioned in the last couple of calls that there are ongoing discussions all the time with the U.S. government and regulatory agencies were part of those discussions and will continue to be. I think in terms of change in behavior by any of our customers, I don't think it's something that's noticeable nor it would be something that we would be able to easily react to. We've talked about how we deal with some of these new customers that emerge with down payments and other things to make sure that we understand the -- those customers as viable customers. But beyond that, we service them like others at this point as long as we can ship to them, I would say, lead times and responsiveness from our perspective is same as we treat any customers of those size.
Joseph Moore: Very helpful. Thank you.
Timothy Archer: Thanks, Joe.
Operator: Next question comes from Blayne Curtis with Jefferies. Please go ahead.
Blayne Curtis: Hey. Thanks for let me ask question. I actually -- I know you got a couple on this, Doug, on the China business. I'm just kind of curious, you -- I think you qualified as a solid year next year, and I just didn't know what that meant. So I know you've been hesitant to kind of call China, I think you called it like flat, plus or minus, maybe up or down last time. Do you feel better about it, I guess, outside of this June that's the other kind of part of the question. Just if you can qualify a little bit. I mean, you should have some idea of what you're going to [indiscernible]. So was June kind of a cleanup and it might be a little bit lumpy and/or is China actually trending a bit better for you?
Douglas Bettinger: I don't know, Blayne, that I'm trying to communicate anything any different than we said on the last call, to be honest with you. We described this year as somewhat first half weighted, really no change to that. The June quarter was maybe a little tiny bit stronger in China, but only a little tiny bit. It's too soon for me to -- for us to quantify 2025. But what I would tell you is, I expect next year to be a solid year in terms of spending in China. I'm not going to give you a number yet, because I'm not completely sure. But what I wouldn't want anybody to think is, it's going away because it's not.
Blayne Curtis: Got you. And then I'm just kind of curious, the broad strokes was growth for next year. I know you don't want to give a forecast. But in terms of the moving pieces there, I mean, it's pretty clear leading etch is strong, DRAM spend is strong. I'm just kind of curious as you look into that forecast, if you're willing to venture kind of a view on the NAND business.
Douglas Bettinger: Yes. I think NAND spending next year has to be greater than it is this year, right? We're off two years of quite low spending in NAND. I don't know at what magnitude. I expect next year -- we expect next year, you're going to see a lot of upgrades in NAND. But too soon for us to give you a number, but I would be shocked if it's not stronger than it is this year, it has to be.
Blayne Curtis: Thanks, Doug.
Douglas Bettinger: Yes. Thanks, Blayne.
Operator: Next question comes from Joe Quatrochi with Wells Fargo. Please go ahead.
Joseph Quatrochi: Yes. Thank for taking the questions. I wanted to try on the NAND side again. If we just think about your prior peak NAND revenue ex customers that are obviously now restricted, can capacity upgrade to just higher layer counts support your return to those levels, just given your higher share of higher etch and depth intensity for the transitions?
Douglas Bettinger: Joe, if it’s just an upgrade year, spending will be lower than when capacity gets added, obviously, our share of wallet will be greater. The fact that we lost a pretty large NAND customer in the China region, hard to replace that. I'm not ready to tell you what kind of next year is relative to previous peaks. But I know next year is going to be a stronger year in NAND than it is this year for sure.
Timothy Archer: Yes. And Joe, I think that obviously, we're talking next year, it's very specific to the demand environment and the upgrade business in 2025. Longer term, I mean, we've laid out, in our view, is that NAND spending rises. And so it's just a matter of the time frame you're looking at. And from the standpoint of Lam's business, the etch and depth components and the complexity of tear stacking the precision that's required for implementation of QLC and PLC technologies, all of these skewed towards Lam's technical strengths and also SAM expansion opportunities. I talked about the PECVD pure carbon gap fill process, which is a new addition to the portfolio for NAND scaling technology going forward. And so, if I go back and I look at where we were in the portfolio, we had to sell, when people used to think of NAND is a very, very strong business for Lam, we've expanded that portfolio quite substantially with the gap fill, the backside stress management, the ALD oxide gap fill process plus the etch and stack debt that we've always had as well as metallization. So it's one of growth in NAND demand, but also growth in Lam's portfolio and served market as well opportunities ahead. So I think that bodes well for us once the NAND business itself starts to recover.
Joseph Quatrochi: That's helpful color. And just as a quick follow-up. You talked about global mature node spending being roughly flat this year. Can you just help us understand just kind of how does that break down? I mean, I think clearly, the non-China piece is pretty weak. But just any kind of color there you could help us parse that out.
Douglas Bettinger: Yes, you answered your own question, Joe. China is decent right now. Outside of China, it's pretty soft. And I think you understand what's going on, There's inventory that's built up for these inventories still need to come down in the mature node, analog, industrial automotive space and investment won't meaningfully occur until that gets adjusted. So that's kind of what's going on. You sort of answered your own question.
Joseph Quatrochi: Fair enough. Thanks.
Douglas Bettinger: Thanks, Joe.
Operator: Next question is a follow-up question from Krish Sankar. Please go ahead.
Krish Sankar: Hi. Thanks for taking my follow up. Doug, I just had a quick follow-up. It's a question on inventory. You spoke about bringing on inventory turns down. I was just kind of curious like how to think about inventory next year, especially you're planning for a strong WFE year in 2025? Or do you think most of this inventory would be in a bin, how to think about inventory next year? Thank you.
Douglas Bettinger: Yes. Listen, if you think back to when business declined for us last year, a big part of what fell off pretty rapidly was our NAND business. And so a lot of the inventory that we still have sitting on the balance sheet will support NAND. So when -- assuming NAND is stronger next year, and it will be, we will consume that NAND inventory that's been sitting on the balance sheet for a while. What will offset that to a certain extent is growth elsewhere, where we'll need to procure new inventory. So I'm not ready to give you an inventory forecast quite yet, but we're continuing to work as we go through the remainder of this year to kind of bring it down and then what we do with next year will depend largely on the timing of business, the mix of business, the geographic distribution of business, but we'd like to get turns back to where they historically have been and they're not there yet. So that's how you should be thinking about it, Krish.
Krish Sankar: Thank you. Very helpful. Thanks, Doug.
Douglas Bettinger: Thanks.
Operator: Next question is from Melissa Weathers with Deutsche Bank. Please go ahead.
Melissa Weathers: Hi, there. Thank you for taking my questions. I wanted to ask on the leading etch and specifically gate all around nodes. I don't think I heard an update to your $1 billion gate all around revenues in 2024 target. So is that still the case? And then as we think about those nodes ramping through next year, like what's the trajectory of that ramp that we should be thinking about as you move from pilot lines into high-volume manufacturing?
Timothy Archer: Yes. Thanks, Melissa. I mean we always make choices about what we do and don't include it in the prepared remarks and gate all around fell out this time, just no intended message. In fact, if I look at what happened in the quarter, Lam, again, as we've talked on previous calls, is really positioned quite nicely with our forward-looking etch and depth portfolios. We really targeted those kind of markets with new tools in selected etch, which is a market we hadn't been in before. And in fact, in the quarter, we had additional selected etch wins for gate all around at multiple customers. We targeted investment in ALD films that are specifically needed for things like spacers and gate all around, and we had additional wins in the quarter for those films. Often with gate all around, we think of those -- they are obviously different technologies, but kind of occurring at the same node, the backside power delivery. That's an area that is really right in our sweet spot in terms of deposition and etch. And in the quarter, we had wins in backside power in ALD oxide. And so I would say net-net, I mean, given those wins and what you're hearing from the end markets about the need for high-power computing demand for AI, I think the $1 billion forecast we gave you, certainly, as we move through next year would be going higher. And so, again, that's a combination of rising demand, but also a product portfolio that's both expanding and one in which we're winning share. And so, there was no message about leaving it off, but thank you for asking the question so we could get that in right at the end.
Melissa Weathers: Okay. Thank you. That’s all my questions there.
Douglas Bettinger: Awesome, operator, I think that concludes our call. I want to thank everybody for joining us today. We look forward to seeing you at a variety of conferences and interactions as we go through the remainder of the quarter. Appreciate it.
Timothy Archer: Thank you.
Operator: Conference is now concluded. Thank you for attending today's presentation. You may now disconnect.
Subscribe now to gain full access to the earnings summary, 5 years analyst estimates and more exclusive content.
Subscribe NowWARNING: AI-generated summary.
While this is a phenomenal tool that can save you time and provide meaningful insights and key takeaways from the earnings call, it may contain inaccuracies or misinterpretations. For precise information, please refer to the original transcript.
(* All numbers are in thousands)
Fiscal Year | 2015 | 2016 | 2017 | 2018 | 2019 | 2020 | 2021 | 2022 | 2023 | 2024 |
---|---|---|---|---|---|---|---|---|---|---|
Revenue | 5,259,312 | 5,885,893 | 8,013,620 | 11,076,998 | 9,653,559 | 10,044,736 | 14,626,150 | 17,227,039 | 17,428,516 | 14,905,386 |
Cost Of Revenue | 2,974,976 | 3,266,971 | 4,410,261 | 5,911,966 | 5,295,100 | 5,436,043 | 7,820,844 | 9,355,232 | 9,651,591 | 7,765,845 |
Gross Profit | 2,284,336 | 2,618,922 | 3,603,359 | 5,165,032 | 4,358,459 | 4,608,693 | 6,805,306 | 7,871,807 | 7,776,925 | 7,139,541 |
Research And Development Expenses | 825,242 | 913,712 | 1,033,742 | 1,189,514 | 1,191,320 | 1,252,412 | 1,493,408 | 1,604,248 | 1,727,162 | 1,902,444 |
General And Administrative Expenses | 0 | 0 | 0 | 0 | 0 | 0 | 0 | 0 | 0 | 0 |
Selling And Marketing Expenses | 0 | 0 | 0 | 0 | 0 | 0 | 0 | 0 | 0 | 0 |
Selling General And Administrative Expenses | 591,611 | 630,954 | 667,485 | 762,219 | 702,407 | 682,479 | 829,875 | 885,737 | 832,753 | 868,247 |
Other Expenses | -47,189 | -114,139 | -90,459 | -61,510 | -18,161 | -98,824 | -111,219 | -188,708 | -65,650 | -24,323 |
Operating Expenses | 1,416,853 | 1,544,666 | 1,701,227 | 1,951,733 | 1,893,727 | 1,934,891 | 2,323,283 | 2,489,985 | 2,559,915 | 2,770,691 |
Cost And Expenses | 4,391,829 | 4,811,637 | 6,111,488 | 7,863,699 | 7,188,827 | 7,370,934 | 10,144,127 | 11,845,217 | 12,211,506 | 10,536,536 |
Interest Income | 19,268 | 29,512 | 57,858 | 85,813 | 98,771 | 85,433 | 19,687 | 15,209 | 138,984 | 251,938 |
Interest Expense | 73,682 | 134,773 | 117,734 | 97,387 | 117,263 | 177,440 | 208,597 | 184,759 | 186,462 | 185,236 |
Depreciation And Amortization | 277,920 | 291,028 | 306,905 | 326,395 | 309,281 | 268,525 | 307,151 | 333,739 | 342,432 | 359,699 |
EBITDA | 1,224,847 | 1,365,284 | 2,209,037 | 3,539,694 | 2,774,013 | 2,942,327 | 4,789,174 | 5,715,561 | 5,601,592 | 4,728,549 |
Operating Income | 788,039 | 1,074,256 | 1,902,132 | 3,213,299 | 2,464,732 | 2,673,802 | 4,482,023 | 5,381,822 | 5,174,860 | 4,368,850 |
Total Other Income Expenses Net | -126,633 | -114,139 | -90,459 | -61,510 | -18,161 | -98,824 | -111,219 | -188,708 | -107,800 | -8,628 |
income Before Tax | 740,850 | 960,117 | 1,811,673 | 3,151,789 | 2,446,571 | 2,574,978 | 4,370,804 | 5,193,114 | 5,109,210 | 4,360,222 |
Income Tax Expense | 85,273 | 46,068 | 113,910 | 771,108 | 255,141 | 323,225 | 462,346 | 587,828 | 598,279 | 532,450 |
Net Income | 655,577 | 914,049 | 1,697,763 | 2,380,681 | 2,191,430 | 2,251,753 | 3,908,458 | 4,605,286 | 4,510,931 | 3,827,772 |
Eps | 0.410 | 0.580 | 1.050 | 1.320 | 1.440 | 1.560 | 2.720 | 3.290 | 3.330 | 2.910 |
Eps Diluted | 0.370 | 0.520 | 0.920 | 1.320 | 1.370 | 1.510 | 2.690 | 3.280 | 3.320 | 2.900 |
Weighted Average Shares Outstanding | 1,596,290 | 1,589,190 | 1,622,220 | 1,807,654.510 | 1,524,780 | 1,448,140 | 1,436,090 | 1,398,990 | 1,354,720 | 1,314,100 |
Weighted Average Shares Outstanding Diluted | 1,770,670 | 1,751,590 | 1,837,700 | 1,807,820 | 1,599,150 | 1,490,900 | 1,453,200 | 1,406,280 | 1,358,340 | 1,319,950 |
Currency | USD | USD | USD | USD | USD | USD | USD | USD | USD | USD |
(* All numbers are in thousands)
Fiscal Year | 2015 | 2016 | 2017 | 2018 | 2019 | 2020 | 2021 | 2022 | 2023 | 2024 |
---|---|---|---|---|---|---|---|---|---|---|
Cash And Cash Equivalents | 1,501,539 | 5,039,322 | 2,377,534 | 4,512,257 | 3,658,219 | 4,915,172 | 4,418,263 | 3,522,001 | 5,337,056 | 5,847,856 |
Short Term Investments | 2,574,947 | 1,788,612 | 3,663,628 | 437,338 | 1,772,984 | 1,795,080 | 1,310,872 | 135,731 | 37,641 | 0 |
Cash And Short Term Investments | 4,076,486 | 6,827,934 | 6,041,162 | 4,949,595 | 5,431,203 | 6,710,252 | 5,729,135 | 3,657,732 | 5,374,697 | 5,847,856 |
Net Receivables | 1,093,582 | 1,262,145 | 1,673,398 | 2,176,936 | 1,455,522 | 2,097,099 | 3,026,430 | 4,313,818 | 2,823,376 | 2,519,250 |
Inventory | 943,346 | 971,911 | 1,232,916 | 1,876,162 | 1,540,140 | 1,900,024 | 2,689,294 | 3,966,294 | 4,816,190 | 4,217,924 |
Other Current Assets | 157,435 | 152,921 | 195,022 | 147,218 | 133,544 | 146,160 | 207,528 | 347,391 | 214,149 | 298,190 |
Total Current Assets | 6,270,849 | 9,214,911 | 9,142,498 | 9,149,911 | 8,560,409 | 10,853,535 | 11,652,387 | 12,285,235 | 13,228,412 | 12,883,220 |
Property Plant Equipment Net | 621,418 | 639,608 | 685,595 | 902,547 | 1,059,077 | 1,071,499 | 1,303,479 | 1,647,587 | 1,856,672 | 2,154,518 |
Goodwill | 2,115,649 | 1,951,197 | 1,796,668 | 1,802,740 | 1,701,547 | 1,652,968 | 1,622,499 | 1,515,113 | 1,622,489 | 1,626,528 |
Intangible Assets | 728,140 | 564,921 | 410,995 | 317,836 | 216,950 | 168,532 | 132,365 | 101,850 | 168,454 | 138,545 |
Goodwill And Intangible Assets | 2,115,649 | 1,951,197 | 1,796,668 | 1,802,740 | 1,701,547 | 1,652,968 | 1,622,499 | 1,616,963 | 1,790,943 | 1,765,073 |
Long Term Investments | 33,463 | 250,421 | 256,204.999 | 256,301 | 256,714 | 326,338 | 348,658 | 471,953 | 26,208 | 2,947 |
Tax Assets | -33,463 | -250,421 | -256,204.999 | -256,301 | -256,714 | -326,338 | -348,658 | -471,953 | -26,208 | -2,947 |
Other Non Current Assets | 356,732 | 465,812 | 498,004 | 624,280 | 680,300 | 981,045 | 1,313,787 | 1,645,847 | 1,905,616 | 1,941,917 |
Total Non Current Assets | 3,093,799 | 3,056,617 | 2,980,267 | 3,329,567 | 3,440,924 | 3,705,512 | 4,239,765 | 4,910,397 | 5,553,231 | 5,861,508 |
Other Assets | 0 | 0 | 0 | 0 | 0 | 0 | 0 | 0 | 0 | 0 |
Total Assets | 9,364,648 | 12,271,528 | 12,122,765 | 12,479,478 | 12,001,333 | 14,559,047 | 15,892,152 | 17,195,632 | 18,781,643 | 18,744,728 |
Account Payables | 300,203 | 348,199 | 464,643 | 510,983 | 376,561 | 592,387 | 829,710 | 1,011,208 | 1,011,208 | 613,966 |
Short Term Debt | 1,359,650 | 949,494 | 908,439 | 610,030 | 667,131 | 839,877 | 11,349 | 7,381 | 8,358 | 504,814 |
Tax Payables | 39,275 | 86,723 | 95,127 | 185,384 | 49,926 | 215,652 | 348,206 | 465,601 | 885,348 | 186,700 |
Deferred Revenue | 322,070 | 349,199 | 607,672 | 720,086 | 381,317 | 457,523 | 967,325 | 1,571,898 | -1,011,208 | 1,417,781 |
Other Current Liabilities | 649,438 | 772,910 | 969,361 | 1,309,209 | 946,641 | 1,272,655 | 1,719,483 | 1,974,272 | 4,176,560 | 1,801,877 |
Total Current Liabilities | 2,631,361 | 2,419,802 | 2,950,115 | 3,150,308 | 2,371,650 | 3,162,442 | 3,527,867 | 4,564,759 | 4,184,918 | 4,338,438 |
Long Term Debt | 1,001,382 | 3,383,581 | 1,784,974 | 1,806,562 | 3,822,768 | 4,970,848 | 4,990,333 | 4,998,449 | 5,003,183 | 4,478,520 |
Deferred Revenue Non Current | 0 | 0 | 0 | 0 | 0 | 0 | 0 | 0 | 0 | 0 |
Deferred Tax Liabilities Non Current | 0 | 0 | 0 | 0 | 0 | 0 | 0 | 0 | 0 | 0 |
Other Non Current Liabilities | 386,953 | 366,076 | 400,364 | 942,565 | 1,083,611 | 1,242,268 | 1,346,764 | 1,354,058 | 1,383,370 | 1,388,315.999 |
Total Non Current Liabilities | 1,388,335 | 3,749,657 | 2,185,338 | 2,749,127 | 4,906,379 | 6,213,116 | 6,337,097 | 6,352,507 | 6,386,553 | 5,866,835.999 |
Other Liabilities | 0 | 0 | 0 | 0 | 0 | 0 | 0 | 0 | 0 | 1 |
Capital Lease Obligations | 8,946 | 205 | 6,143 | 46,346 | 28,494 | 15,247 | 40,747 | 43,371 | 46,597 | 15,973 |
Total Liabilities | 4,019,696 | 6,169,459 | 5,135,453 | 5,899,435 | 7,278,029 | 9,375,558 | 9,864,964 | 10,917,266 | 10,571,471 | 10,205,274 |
Preferred Stock | 0 | 0 | 0 | 0 | 0 | 0 | 0 | 0 | 0 | 0 |
Common Stock | 159 | 160 | 162 | 157 | 144 | 145 | 143 | 137 | 133 | 130 |
Retained Earnings | 4,096,855 | 4,820,109 | 6,249,691 | 8,261,194 | 9,930,919 | 11,520,591 | 14,684,912 | 18,454,724 | 22,032,096 | 24,811,315 |
Accumulated Other Comprehensive Income Loss | -57,796 | -69,333 | -61,700 | -57,449 | -64,030 | -94,211 | -64,128 | -109,982 | -100,706 | -130,428 |
Other Total Stockholders Equity | 1,305,734 | 1,351,133 | 799,159 | -1,623,859 | -5,143,729 | -6,243,036 | -8,593,739 | -12,066,513 | -13,721,351 | -16,141,563 |
Total Stockholders Equity | 5,344,952 | 6,102,069 | 6,987,312 | 6,580,043 | 4,723,304 | 5,183,489 | 6,027,188 | 6,278,366 | 8,210,172 | 8,539,454 |
Total Equity | 5,344,952 | 6,102,069 | 6,987,312 | 6,580,043 | 4,723,304 | 5,183,489 | 6,027,188 | 6,278,366 | 8,210,172 | 8,539,454 |
Total Liabilities And Stockholders Equity | 9,364,648 | 12,271,528 | 12,122,765 | 12,479,478 | 12,001,333 | 14,559,047 | 15,892,152 | 17,195,632 | 18,781,643 | 18,744,728 |
Minority Interest | 0 | 0 | 0 | 0 | 0 | 0 | 0 | 0 | 0 | 0 |
Total Liabilities And Total Equity | 9,364,648 | 12,271,528 | 12,122,765 | 12,479,478 | 12,001,333 | 14,559,047 | 15,892,152 | 17,195,632 | 18,781,643 | 18,744,728 |
Total Investments | 2,574,947 | 1,788,612 | 3,663,628 | 437,338 | 1,772,984 | 1,795,080 | 1,310,872 | 135,731 | 63,849 | 2,947 |
Total Debt | 2,361,032 | 4,333,075 | 2,693,413 | 2,416,592 | 4,489,899 | 5,810,725 | 5,001,682 | 5,005,830 | 5,011,541 | 4,983,334 |
Net Debt | 859,493 | -706,247 | 315,879 | -2,095,665 | 831,680 | 895,553 | 583,419 | 1,483,829 | -325,515 | -864,522 |
Currency | USD | USD | USD | USD | USD | USD | USD | USD | USD | USD |
(* All numbers are in thousands)
Fiscal Year | 2015 | 2016 | 2017 | 2018 | 2019 | 2020 | 2021 | 2022 | 2023 | 2024 |
---|---|---|---|---|---|---|---|---|---|---|
Net Income | 655,577 | 914,049 | 1,697,763 | 2,380,681 | 2,191,430 | 2,251,753 | 3,908,458 | 4,605,286 | 4,510,931 | 3,827,772 |
Depreciation And Amortization | 277,920 | 291,028 | 306,905 | 326,395 | 309,281 | 268,525 | 307,151 | 333,739 | 342,432 | 359,699 |
Deferred Income Tax | 5,551 | -49,003 | 104,936 | 3,046 | -4,980 | -17,777 | -151,477 | -257,438 | -172,061 | -198,981 |
Stock Based Compensation | 135,354 | 142,348 | 149,975 | 172,216 | 187,234 | 189,197 | 220,164 | 259,064 | 286,600 | 293,058 |
Change In Working Capital | -420,857 | -52,229 | -310,832 | -317,193 | 491,524 | -571,875 | -678,741 | -1,796,226 | 158,738 | 360,478 |
Accounts Receivables | -294,155 | -169,034 | -411,287 | -501,628 | 732,138 | -641,827 | -928,928 | -1,287,680 | 1,452,256 | 303,443 |
Inventory | -207,462 | -66,371 | -307,875 | -701,008 | 281,355 | -411,608 | -792,591 | -1,351,344 | -961,968 | 528,723 |
Accounts Payables | 76,617 | 41,645 | 126,819 | 35,655 | -131,472 | 208,478 | 184,615 | 167,884 | -522,200 | 125,939 |
Other Working Capital | 4,143 | 141,531 | 281,511 | 849,788 | -390,497 | 273,082 | 858,163 | 674,914 | 190,650 | -277,440 |
Other Non Cash Items | 131,958 | 104,084 | 80,535 | 90,602 | 1,524 | 6,628 | -17,392 | -44,751 | 52,298 | 1,022,699 |
Net Cash Provided By Operating Activities | 785,503 | 1,350,277 | 2,029,282 | 2,655,747 | 3,176,013 | 2,126,451 | 3,588,163 | 3,099,674 | 5,178,938 | 4,652,269 |
Investments In Property Plant And Equipment | -198,265 | -175,330 | -157,419 | -273,469 | -303,491 | -203,239 | -349,096 | -546,034 | -501,568 | -396,670 |
Acquisitions Net | 40,075 | 175,330 | 157,419 | -115,697 | 303,491 | 203,239 | 349,096 | 0 | -119,955 | 0 |
Purchases Of Investments | -952,240 | -874,998 | -1,883,886 | -2,532,829 | -1,326,208 | -2,897,627 | -3,389,388 | -567,819 | -98,132 | 0 |
Sales Maturities Of Investments | 2,137,068 | 798,828 | 2,697,965 | 3,152,886 | 1,603,841 | 2,882,627 | 3,853,910 | 1,733,703 | 98,132 | 37,766 |
Other Investing Activites | -2,132,734 | 668,653 | -2,872,692 | 2,517,549 | -1,914,687 | -229,084 | -391,251 | -7,575 | 86,961 | -11,710 |
Net Cash Used For Investing Activites | -1,106,096 | 592,483 | -2,058,613 | 2,748,440 | -1,637,054 | -244,084 | 73,271 | 612,275 | -534,562 | -370,614 |
Debt Repayment | -1,515 | -451,497 | -1,688,313 | -1,505,694 | -117,653 | -1,917,537 | -862,060 | -11,889 | -23,206 | -256,103.999 |
Common Stock Issued | 66,323 | 59,397 | 72,576 | 84,882 | 6,813 | 8,084 | 24,123 | 5,682 | 11,111 | 135,519 |
Common Stock Repurchased | -573,240 | -158,389 | -811,672 | -2,653,249 | -3,780,611 | -1,369,649 | -2,697,704 | -3,865,663 | -2,017,012 | -2,842,807 |
Dividends Paid | -116,059 | -190,402 | -243,495 | -307,609 | -678,348 | -656,838 | -726,992 | -815,290 | -907,907 | -1,018,915 |
Other Financing Activites | 1,002,963 | 2,336,636 | 38,510 | 1,109,613 | 2,179,719 | 3,312,010 | 95,651 | 108,223 | 106,347 | -13,543 |
Net Cash Used Provided By Financing Activities | 378,472 | 1,595,745 | -2,632,394 | -3,272,057 | -2,390,080 | -623,930 | -4,166,982 | -4,578,937 | -2,830,667 | -3,995,850 |
Effect Of Forex Changes On Cash | -9,017 | -722 | -63 | 2,593 | -4,041 | -2,750 | 7,215 | -30,227 | 128 | -22,374 |
Net Change In Cash | 48,862 | 3,537,783 | -2,661,788 | 2,134,723 | -855,162 | 1,255,687 | -498,333 | -897,215 | 1,813,837 | 510,800 |
Cash At End Of Period | 1,501,539 | 5,039,322 | 2,377,534 | 4,512,257 | 3,913,396 | 5,169,083 | 4,670,750 | 3,773,535 | 5,587,372 | 5,847,856 |
Cash At Beginning Of Period | 1,452,677 | 1,501,539 | 5,039,322 | 2,377,534 | 4,768,558 | 3,913,396 | 5,169,083 | 4,670,750 | 3,773,535 | 5,337,056 |
Operating Cash Flow | 785,503 | 1,350,277 | 2,029,282 | 2,655,747 | 3,176,013 | 2,126,451 | 3,588,163 | 3,099,674 | 5,178,938 | 4,652,269 |
Capital Expenditure | -198,265 | -175,330 | -157,419 | -273,469 | -303,491 | -203,239 | -349,096 | -546,034 | -501,568 | -396,670 |
Free Cash Flow | 587,238 | 1,174,947 | 1,871,863 | 2,382,278 | 2,872,522 | 1,923,212 | 3,239,067 | 2,553,640 | 4,677,370 | 4,255,599 |
Currency | USD | USD | USD | USD | USD | USD | USD | USD | USD | USD |
(* All numbers are in thousands)
Revenue (TTM) : | P/S (TTM) : | 5.78 | ||
Net Income (TTM) : | P/E (TTM) : | 22.43 | ||
Enterprise Value (TTM) : | 89.048B | EV/FCF (TTM) : | 18.4 | |
Dividend Yield (TTM) : | 0.01 | Payout Ratio (TTM) : | 0.26 | |
ROE (TTM) : | 0.49 | ROIC (TTM) : | 0.3 | |
SG&A/Revenue (TTM) : | 0 | R&D/Revenue (TTM) : | 0.13 | |
Net Debt (TTM) : | 14.905B | Debt/Equity (TTM) | 0.59 | P/B (TTM) : | 10.74 | Current Ratio (TTM) : | 2.53 |
Trading Metrics:
Open: | 70.01 | Previous Close: | 70.17 | |
Day Low: | 68.87 | Day High: | 70.22 | |
Year Low: | 68.72 | Year High: | 113 | |
Price Avg 50: | 77.27 | Price Avg 200: | 89.13 | |
Volume: | 7.664M | Average Volume: | 12.588M |