Exchange: | NYSE |
Market Cap: | 28.979B |
Shares Outstanding: | 1.827B |
Sector: | Energy | |||||
Industry: | Oil & Gas Integrated | |||||
CEO: | Mr. Jonathan M. McKenzie CA | |||||
Full Time Employees: | 6925 | |||||
Address: |
|
|||||
Website: | https://www.cenovus.com |
Click to read more…
Operator: Good morning, ladies and gentlemen. Welcome to Cenovus Energy’s Third Quarter Results Conference Call. At this time, all participants are in listen-only mode. Following the presentation, we will hold a question-and-answer session. [Operator Instructions]. I would like to remind everyone that this conference is being recorded today. I would now like to turn the meeting over to Mr. Patrick Read, Vice President, Investor Relations. Please go ahead, Mr. Read.
Patrick Read: Thank you, operator. Good morning, everyone, and welcome to Cenovus’s 2024 third quarter results conference call. On the call this morning, our CEO, Jon McKenzie, will take you through our results. Then we'll open the line for Jon and other members of the Cenovus management team to take your questions. Before getting started, I'll refer you to our advisories located at the end of today's news release. These describe the forward-looking information, non-GAAP measures, and oil and gas terms referred to today. They also outline the risk factors and assumptions relevant to this discussion. Additional information is available on Cenovus’s annual MD&A and our most recent AIF and Form 40-F. And as a reminder, all figures we reference on the call today will be in Canadian dollars, unless otherwise indicated. You can view our results at cenovus.com. For the question and answer portion of the call, please keep to one question with a maximum of one follow-up. You are welcome to rejoin the queue for any other follow-up questions you may have. We also ask that you hold off on any detailed modeling questions. You can follow up on those directly with our investor relations team after the call. I will now turn the call over to Jon. Jon, please go ahead.
Jon McKenzie : Great and thank you Patrick, and good morning everyone. As always, I like to start these calls by highlighting our safety performance in the quarter. The third quarter was a very heavy maintenance period for the company, and we have safely completed three major plan turnarounds on our ahead of schedule across both the upstream and the downstream. I'd like to thank all of our people for their continued commitment to safety and our core values as we accomplish these tasks. Completing this work effectively and on time with an excellent safety record is critical to maintaining safe and reliable operations and positions us well for the remainder of the year and into 2025. Our third quarter results highlight the strength of our operations, our continued focus on execution, as well as our commitment to shareholder returns and to maintaining our strong balance sheet. Our upstream business continued to deliver strong operating results with production of approximately 771,000 BOE per day and an operating margin of $2.7 billion. In our oil sands segment, the volumes impacted by the turnaround at Christina Lake were restored well ahead of schedule, as work on some of the phases was completed early, and the full scope of the turnaround was completed eight days ahead of plan. As a result, we delivered Christina Lake production in the third quarter that exceeded our forecast by 15,000 to 20,000 barrels of oil per day. This achievement is a testament to our operating team, whose detailed planning and exceptional focus on execution drove incremental value to Cenovus. As a result, our oil sands segment delivered 586,000 barrels of oil in the third quarter -- barrels per day in the third quarter, and an operating margin of $2.5 billion. Christina Lake was brought back online through September and has been performing very well through October. During the turnaround, we completed pipeline tie-in work that will support new production from Narrows Lake next year. This pipeline is now 93% constructed and the project remains on track to add 20,000 to 30,000 barrels a day to Christina Lake with first production in mid-25. Combined with the continued development activities at Sunrise and Foster Creek Optimization Project, we expect to see material growth in the oil sands business over the next two years. We expect all these projects to be highly profitable, even at bottom-of-the-cycle pricing, and they collectively add significant incremental value at very low capital cost. In all, I'm very pleased with the performance of our industry-leading oil sands assets so far this year and expect the operational momentum to continue through the rest of the year and into 2025. The third quarter is also the first full period of operations of the TMX pipeline, which has provided additional egress capacity and access to new global markets for our crude. This has had a positive impact not only for Cenovus but for the whole Canadian economy. We are seeing the benefits of a narrow, less volatile WCS differential, which strengthens the realized price for all Canadian oil production. TMX shipments have gone well and we have successfully ramped up to full contracted rates. In our conventional gas business, production volumes were about 118,000 BOE per day. Volumes were impacted by turnaround activity at Rainbow Lake and other facilities, which was successfully completed through the quarter. With weak natural gas prices continuing through the third quarter, we have deferred completion of some of our gas-weighted wells towards the end of the year. Our new wells are primarily targeting liquids-rich opportunities. In our offshore business segment, production was approximately 66,000 BOE per day, in line with the prior quarter. Asia-Pacific production continues to exceed our forecast, even with successful completion of the planned maintenance of both the offshore Liwan platform and onshore gas plant. Operating margin from this business was $242 million, and we expect to see benefit from strong regional gas demand going forward. In the Atlantic region, we have completed the asset life extension work on the SeaRose FPSO at Dry Dock in Belfast. The vessel is now returning to the field, with production from the existing White Rose field expected to resume by year-end. Completing this work will extend the life of the vessel to 2038, and is a major milestone for the Atlantic business, and a very important step in the delivery of the West White Rose project. The entire West White Rose project now stands at 85% complete, and remains on track for first oil in 2026. Turning to Canadian refining, our Lloyd-Minster upgrader and refinery ran at combined utilization of 92% for the quarter. Utilization was impacted by the turnaround activity at the upgrader that was completed in early July. Since the completion of the turnaround, both the upgrader and the refinery have run at or near full rates. In the U.S. refining segment, crude utilization was 89% in the quarter. Our crude throughput was 544,000 barrels per day, and was impacted by the major turnaround at the Lima refinery. The turnaround started in September and was successfully completed on schedule in late October. The operating margin shortfall of $383 million in the quarter included inventory timing losses of about $210 million, and about a $100 million of turnaround expenses and related expense projects executed during the Lima turnaround. In both the Lima turnaround and Lloyd upgrader turnaround completed earlier this year, we made targeted investments to address historical reliability issues. We have addressed coker [ph] integrity issues at both sites and completed equipment renewal work on our fluid catalytic cracker at Lima, positioning both sites for improved operating performance and profitability. Our ability to capture available margin in the U.S. refining segment was also impacted by the Lima turnaround, where the coker and fluid catalytic cracker units were taken offline in September as part of the turnaround scope. Now with this plan of maintenance at Lima behind us, all of our refineries are online. We are firmly committed and focused on improving the competitiveness of our U.S. refining business by improving asset reliability, lowering our cost structure, and capturing more value from the commercial opportunities across the network. This work is progressing at pace with an absolute sense of urgency. I'd now like to highlight our corporate and financial performance. We generated $2.4 billion in operating margin in the third quarter, approximately $2 billion of adjusted funds flow, and about $600 million of free funds flow. Capital investment in the third quarter was $1.3 billion, as plan spending on our growth and optimization project has ramped up in the second half of the year. Our annual guidance for capital spending of $4.5 billion to $5 billion remains unchanged. In the month of July, we achieved our net debt target of $4 billion, and at the end of the third quarter, net debt was approximately $4.2 billion. We are aiming to return 100% of our excess free funds flow to shareholders overtime while continuing to steward to net debt of about $4 billion. Through our base dividend and share buyback program, we returned approximately $1.1 billion of cash to our shareholders in the quarter, far exceeding 100% of our excess free funds flow. Shareholders benefited from the excess free funds flow as well as the working capital release of approximately $600 million, allowing us to return more cash to shareholders than anticipated. In closing, we delivered strong operational results through a heavy maintenance period in the third quarter and continued to make meaningful progress on our growth projects across the portfolio. With our major projects behind us, we expect to see increased upstream production and increased reliability from our downstream in the fourth quarter. We remain focused on maintaining strong operational performance in the upstream, improving the competitiveness of our downstream, and delivering on our growth projects. We have a clear view and a focus of the work in front of us and will continue to progress both our short- and long-term goals for Cenovus. And with that, we're happy to take your questions.
Operator: Thank you. [Operator Instructions]. First question is Dennis Fong from CIBC World Markets. Please go ahead.
Dennis Fong : Hi. Good morning, and thanks for taking my question. The first one is just related, and I guess appreciate your comments just around the work that you're doing on the downstream side. I understand, again, kind of through the Investor Day and through conference calls, Keith has maybe highlighted some bad actors and, frankly, what you're focusing on, and understanding that you've already installed kind of your management systems as well as personnel at your refineries. But would you mind just highlighting some of the specific, we'll call it, items that you're changing, fixing, replacing kind of between now and into next year that you believe can help drive stronger utilization and help kind of drive more consistent operational uptime from your U.S. manufacturing business?
Jon McKenzie : Yeah, Dennis, maybe I'll take the first part of that question, and Keith may want to chime in. But we've really attacked the downstream on a lot of different fronts. We've made a lot of changes on personnel. We've been doggedly going after our reliability issues both in Canada and the U.S., and I think we're making reasonable progress. I think one of the things you'll notice this quarter is that while the throughput numbers are up, the profitability is down. In our primary refining units, we're making good progress. What we didn't see in the second quarter, or sorry, the third quarter was the same level of reliability in some of our secondary units. As we work through some of these major maintenance outages that we had in Lima and we had in Lloydminster this year, we can get at some of the reliability issues inside some of those units that require full plant shutdowns. Coming out of the turnaround in Lloydminster, we've seen excellent reliability in Lloydminster. We expect to see the same coming out of the outage in Lima, and we continue to make good progress. But we're attacking this at a reliability level, a commercial level, and a cost level. But the key thing for us is to get the reliability to a place where we can execute on our plans, and although we make progress, we know we're not there yet.
Operator: Thank you. The next question is Greg Pardy from RBC Capital Markets. Please go ahead.
Greg Pardy : Thanks. Good morning, and thanks for the rundown, Jon. Just, I guess, a couple of things. The first one is probably just a basic one, but on the cap structure, we're getting some questions right now just on the prefs. How they kind of fit into your cap structure? Is this something you'd look at redeeming at some point in time? I know it's not a net debt number. I'm just curious how to kind of think about those right now.
Kam Sandhar: Hey, Greg, it's Kam. So, a couple things I would just say on the prefs. I think first off, you're right in your characterization of they are not included as part of our net debt calculation because we typically just take gross debt plus cash. We've got a number of, I think, five series of prefs outstanding, first of which has a rate reset on December 31st of this year for a $250 million. So, I think when you think of all of them, inclusive of the one in December here, we'll look at various aspects of whether it makes sense to hold, to continue, to extend those or pay them out. And market conditions will really dictate whether we do that or not. But I think at the end of the day, we're going to make the best decision for the company. If we do decide to take those out, there's a 30-day notice period required on any of the prefs and they are typically taken out at par. So, we've got some time to think about whether we do that, but we'll do what's best for the organization in terms of either extending those or acquiring them, outright, and retiring them.
Greg Pardy : Okay. Thanks very much on that. And maybe just to take the question from the last one, sorry, I'm getting an echo on the line here. That's why I'm sounding discombobulated. But when it comes to the refining, initially, right, the thinking was the increase in the downstream then dampens your cash flow volatility. Presumably, that's just a more stable business and so forth. But obviously, with what we've seen, particularly with the US, is that it's actually worked in the other direction. It's probably amplified volatility. And some of that is obviously the inventory movements. I'm just curious as to whether you're thinking internally around, whether it's presentation or how you present it, or how you kind of think about the business? I know you gave up, hedging in the downstream some time ago. How does that business segment, even say when it's running operationally as to how you want it, how does it start to become a contributor to your valuation as opposed to a detractor?
Kam Sandhar: Yeah, I think, Greg, I'll start again. And if others want to chime in, they can. Remember that our refineries that we have serve a couple of different purposes for the company. The refineries that we own are pipeline connected to Western Canada. And they give us egress out of Western Canada. Our wholly owned refineries give us about 300,000 barrels a day of egress through Lloydminster, Toledo, Lima and Superior. That's extremely important to this company versus backing up those barrels inside Hardesty and selling it at the prevailing differential of the day. Second thing they do is they give us insulation against the heavy oil differential and convert that heavy oil into transportation products. They give us a margin over and above heavy oil prices in pad two. Those two things are incredibly important to this company and it's incredibly important to the integrated value chain. So what we've always said is we will capture more of the value chain having the integration with the refineries. There will always be volatility in the U.S. refining business. We're always going to be subject to differentials and widening and contracting of crack spreads. But the real key to making it predictable, which I think is at the root of your question, is getting after these reliability issues. If we can run with reliability that we think we can, you're going to see much more predictable crack capture and you're also going to see lower costs. So getting after the reliability is what we've really been focusing on to demonstrate the value of the value chains that we've built. But these refineries are incredibly important to this business model and nothing can be a higher priority than getting the reliability to a place where you can see that value.
Greg Pardy : Understood. Thanks a lot, guys.
Kam Sandhar: Thanks, Greg.
Operator: Thank you. The next question is John Royall from JP Morgan. Please go ahead.
John Royall : Hi, good morning. Thanks for taking my question. So my first question is on the SeaRose FPSO. Just maybe a little more detail on the timing and some of the milestones between here and getting to startup by year end. When do you expect it to actually be on site and then what are the steps to getting to startup from there? And maybe any view on how production will ramp and when it could get full?
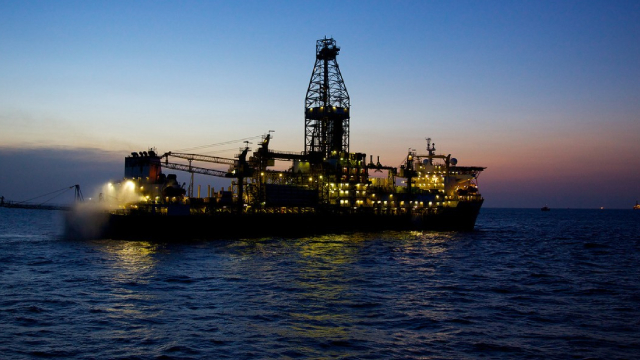
Keith Chiasson : Hey, John. Keith here. Thanks for the question. Pretty significant milestone for us finishing the life extension project in Ireland. Currently, the SeaRose is on route to the site and we expect it to arrive in the next couple of days. From there, it's really just reconnecting to the production system and that can take 30 to 45 days, which kind of aligns to Jon indicating ramping up production at the back end of this year and into the New Year. Two things, obviously, with the SeaRose life extension. One is going to be the 2025 production that comes with it. But as importantly is the fact that we now have the vessel ready for the West White Rose project, which basically enables this vessel to produce and receive production for an additional 14 to 15 years from today. So pretty excited about having this completed. It's another big checkmark and milestone on the overall West White Rose project, as well as anticipating some production in 2025, which we'll outline as we come out with our budget here in the back end of this year.
John Royall : Thanks, Keith. And then my follow up is on Christina Lake and just operationally there kind of what's going right. It seems like the turnaround came back a little bit early and you also had really strong production, I think, going into the turnaround. So maybe just any commentary on kind of that early completion of the turnaround and just generally what's going right with Christina Lake operations.
Keith Chiasson : Yeah, Jon, thanks for the question. Really, really good performance from the team on two fronts. In Jon's opening remarks, he talked about the overall turnaround being done eight days ahead of what we had planned, which is a pretty significant achievement. But also the team was able to optimize through the turnaround and bring production on earlier through one of the phases that was able to complete earlier than we originally planned. And we were able to optimize production through that phase to get a lot of volume back in a time period. Now the other key thing for us in that turnaround was the tie into the Narrows Lake pipeline. So we were able to complete that tie in, which sets us up for that growth project, which we would anticipate starting to steam in the first half of 2025 and starting to see production in mid 2025. So a couple of really big milestones through the Christina Lake. But as you indicated, the performance at that asset continues to outperform and to the upside, which is obviously good news.
John Royall : Thank you.
Operator: Thank you. The next question is Menno Hulshof from TD Securities. Please go ahead.
Menno Hulshof : Thanks and good morning, everyone. I'll start with a high level question on securing new takeaway capacity operations. And maybe we could also get a refresh on where you're currently focusing your efforts, including improved refined product egress out of that, too. Thank you.
Jon McKenzie : Yeah, I'll start that. And I know Geoff Murray is going to want to chime in on this. As it relates to heavy oil production, Menno, we produce somewhere around 800,000 to 850,000 barrels a day of blend. And today we've got takeaway capacity for about 600,000 barrels of that. And that would include the amount that we process in the province of Alberta. And we're reasonably happy with that number. With the expansion projects we've got, that 800 should grow to something north of 900. So about two thirds of our production has ability to get outside the province or processed in the province with the existing egress we've got. You'll also remember that we have rail capacity at Bruderheim. So we always have an option to move up to two unit trains a day of rail capacity should we see differentials widen. And we're always watching the market in terms of additional egress that may come available for us. But suffice it to say, we're reasonably happy being somewhere between 75% and 66% covered with egress, with the idea that we have the ability or option to move another 120 by rail. In terms of Pad 2, I'll let Geoff talk about that because there have been some developments around Broadway. But we are looking to push product beyond Pad 2. We've talked openly about the need to get into Pad 1 and potentially Canada as well. But expanding our area for product placement beyond the immediate Ohio Valley has always been a priority for us as well.
Geoff Murray: Thanks, Jon. Menno, it's Geoff Murray. As Jon indicated, we've been looking at ways to move volume from our refined products out of our existing orbits, generally heading east. Broadway 3 is a project we've worked on with partner and recently signed into a commitment there, which we anticipate will turn into volume flowing east by late next year. And that's going to work both for us and for other industry partners in the area as well. We also have other opportunities, which we are continuing to progress, looking both north and south, possibly with refined products on water. We have a unique opportunity at our Toledo facility to be able to load barges and move product out of the orbit as well. And I think that's going to be pretty front and center for us through the balance next year.
Menno Hulshof : Thanks for that.
Operator: Thank you. Next question is Neil Mehta from Goldman Sachs. Please go ahead.
Neil Mehta : Good morning, Jon team. First question is just on early flavor for 2025 capital, recognizing you're getting through the heart of West White Rose here. And so the capital improvement should be in the viewfinder. But just your perspective on how ‘25 capital could shake out?
Jon McKenzie : Yeah, Neil, it's Jon. And thanks for the question. Nothing's really changed on capital expectations going into 2025. We laid out a capital program, a five-year program at our Investor Day earlier this year, where we talked about the growth projects that we've got under development now being largely completed in 2025. And I think we steered you towards $4.5 billion to $5 billion for 2025 as being a good number. We'll come out with a formal budget in December, but that's a good number to put into your models for 2025. And then we see a capital ramp down following that with the growth projects coming on to production.
Neil Mehta : Yeah, that's kind of the follow-up. You talk about West White Rose and you spent a little time talking about offshore, but that's going to be such a big contributor to the uplift in free cash flow as capital rolls off. And then that project contributes to cash flow in a couple of years. What are the biggest risks that you need to de-risk as we go into next year? And I'm thinking the top side being part of it, but just your perspective on a couple of those moving pieces.
Jon McKenzie : Yeah, I'll let Keith answer that question. But you're absolutely right. This is a project that today is consuming $700 million to $800 million per year, and that's a good number for next year. But then that quickly flips over with production to generating free cash flow in material quantities for this company at sort of mid-cycle pricing. We anticipate cash flow from the field being well in excess of a billion dollars a year. So a huge inflection point from consuming something close to a billion a year to producing something close to a billion a year that we should start seeing in the 2027 time-frame. But Keith, maybe you can talk a little bit about where we are in the project and some of the risks that you see bringing this on for first half.
Keith Chiasson : Yeah, thanks. Thanks, Jon. Neil, really, we look at this in several components, and a couple of them were completed this quarter, so pretty excited about that. We talked about the asset life extension work finishing up in Ireland. The boat is on its way back. And what that does is make sure that we have an FPSO that'll last us for the next 14 to 15 years as we bring on West White Rose production. The other thing that we have completed in the quarter is our concrete gravity structure. We're starting to flood the graving dock in Argentina in anticipation of towing that out in kind of the second quarter of 2025. So really good progress on the gravity-based structure. The third component, and you alluded to it, is our topsides. We need to be ready to able to transport those up to the region in the second quarter of 2025. Currently, they're sitting around 95% mechanically complete. In addition to that, we've already commenced commissioning on the topsides. So the construction work is nearing an end, and we will be getting that ready for transport and sea fastening in the first quarter of 2025. So things are progressing well there. The last two components are towing the topsides up and mating it with the gravity-based structure, and then commencing of drilling in the back end of 2025 for the production to start in 2026. So excited about kind of the rate of change going from spending the $700 million to $800 million a year for the past year and into 2025 to producing significant free funds flow in 2026 and beyond.
Neil Mehta : Thanks, Keith. Thanks, Jon.
Jon McKenzie : Thank you Neil.
Operator: Thank you. Next question is Manav Gupta from UBS. Please go ahead.
Manav Gupta : Good morning, guys. I wanted to ask you because this is a question we always get when crude starts to tumble a little. First, what's your break even without growth CapEx in terms of what WTI price would allow you to pay a dividend without the growth CapEx? And then again, what's the WTI price with the growth CapEx? And the reason I'm asking is my hunch is that the second number with the growth CapEx is around 50 or maybe slightly lower. So even if crude is at 65, you should still be able to return cash to shareholders through buyback. So if you could give us some idea on those numbers.
Kam Sandhar: Yeah, Manav, it's Kam here. So you actually correct numbers you just quoted. So if you look at how we look at our sustaining capital and our base dividend, we typically have said, we really want to make sure that that's fully funded in a $45 WTI environment. And I would say that is absolutely the case today. So when you look at our base dividend, which we would say continues to have room for growth as you as you execute on the growth plan, Keith and Jon have talked about, we should be able to continue to show base dividend growth and maintain that sustaining capital in and around that $3 billion to $3.5 billion range. When you do factor in the growth capital that we've got planned this year and talk at a high level directionally, that $4.5 billion to $5 billion in aggregate spend on an annual basis for 2024 and 2025, you do triangulate to around sort of a low $50 WTI price from a total break-even point of view. So, I think what's important there is we're continuing to manage our capital in a world that's significantly lower than today. And so, I think what that should point you towards is, we want to be making minimal changes in stopping and starting these projects, which Jon and Keith have alluded to in that, the program we highlighted for you back at Investor Day, there shouldn't be any material deviations from the projects that are part of that plan going into 2025.
Manav Gupta : Perfect. My quick follow up is a little bit on the you're looking at drilling multilaterals in manual versus traditional wells, and this could allow you to raise like a heavy oil production on the conventional side. Can you talk about that opportunity effect?
Jon McKenzie : Yeah, sure. Pretty exciting opportunity for us. In our Investor Day pack, we talked about growth that we should see from our conventional heavy oil business. We are very active in the region as we speak with numerous drilling rigs, executing those multilateral wells. It really opens up the resource for us. And as you may know, we're one of the largest landowners in the region. In addition to that, it's also connected through our midstream business into our downstream upgrader and refinery. So, we actually have a pretty integrated value chain all contained within a very tight geographical region. So, pretty excited about what's happening in our conventional heavy oil. We're active in drilling. You should start seeing production ramping from that region in the back half of this year and into 2025 as per one of the opportunities that we laid out for growth across our portfolio.
Manav Gupta : Thank you so much for taking my questions.
Jon McKenzie : Yeah, thank you, Manav.
Operator: Thank you. Next question is Travis Wood from National Bank Financial. Please go ahead.
Travis Wood: Yeah, thanks for taking my question. I just wanted to get a sense of what's left for the Narrows tieback. You're more than 90% complete, I think it said. And is it more weather dependent, just as we head into the winter time frame? Or are there other kind of supply chain issues in front of you?
Jon McKenzie : Yeah, Travis. No, we're essentially mechanically complete on the pipeline. And your assumption is directionally correct. We're trying to optimize on top of it. But in fact, we will need to wait for warmer weather following the winter for the initial startup of the steam line. So that's what's really driving the timing now for Narrows. The key component that we just executed in the turnaround was a tie-in. But that's now behind us. And so we have a little bit of insulation to complete a little bit of heat tracing. But in general, the pipeline and the pads are ready. It's just waiting for the weather window to commence startup of the steam system.
Travis Wood: Okay, perfect. And is there a chance that, or I guess another way, is it budgeted on a normal winter?
Jon McKenzie : Yeah, we're looking at kind of starting that system up in the April time period. And we should be well into a weather window there that will allow us to do that.
Travis Wood: Okay, thanks. That's all for me.
Jon McKenzie : Great, thanks, Travis.
Operator: Thank you. Next question is Patrick O'Rourke from ATB Capital Markets. Please go ahead.
Patrick O'Rourke : Hey, good morning, guys. And thank you for taking my question. I guess just to go back to the strategic nature of the downstream assets, I think one of the things in the past that's worked to your advantage is the nomination process. And I think you kind of alluded to that as well. Just wondering, based on your views, now you get a pretty sophisticated view of the base and marketing egress, all of that. When do you really see that from a time frame kicking in at this point as an advantage for you again?
Jon McKenzie : Just in terms of the differential? Is that the question you're asking?
Patrick O'Rourke : Yeah, and in terms of your ability to nominate in the mainline system.
Jon McKenzie : Yeah, so we can nominate today, Patrick, and we can move barrels to Superior for somewhere around US$3 to US$4 and farther down the line to Toledo for the $5 to $6 range. So we take advantage of that today. We think that at some point over the next two to three years, differentials will widen and that will become more and more pronounced in terms of the advantage that it gives us. But having access to the Enbridge line and being able to nominate, not have to pay for take or pay capacity and not have to make those large financial commitments, be able to move barrels if and when we choose at those kind of rates, we see as being a real strategic advantage. So having refineries along the mainline that have short supply chains back to Western Canada and produce products into strategically advantaged markets like Superior and Toledo do, gives us, I think, a significant advantage on those value chains.
Patrick O'Rourke : Okay, thank you. And then maybe I asked this last quarter, but now that you've got sort of a full quarter run rate under your belt with TMX here, how the netbacks look and what the marketing opportunities have been there for you?
Geoff Murray: Patrick, it's Geoff Murray. It's a great question. As you mentioned, we have had a good bit of run rate here. We've seen really solid operational performance with Trans Mountain. I would say we continue to see really robust competition at the dock. We have ability to see through into some other placement product that's a little further afield and demonstrate to ourselves that pricing is reflective of global value. And what we're finding is, looking a little bit forward here, is that the netbacks associated with that line, I guess I would say the ARV associated with that line, is getting to the place where it's covering full cost of investment, both fixed costs as well as variable. And we think that's an important day as we look forward. And that means that we're seeing things that are covering our costs of full investment in the very near future.
Patrick O'Rourke : Okay, thank you.
Jon McKenzie : Thanks, Patrick.
Operator: Thank you. [Operator Instructions]. The next question is Menno Hulshof from TD Securities. Please go ahead.
Menno Hulshof : Thank you. I just had a really quick one. What is the status of total negotiations for the uncapped portion of the TMX overrun? And what is your best guess in terms of resolution? I think last time this came up on the call, I think it was suggested that it was sometime in the spring. But any thoughts there would be helpful.
Geoff Murray: Menno, Geoff Murray, I think you've got it. There's no particular update from last time. We are following through the regulatory process. I think it'd be remiss of anybody to attempt to predict necessarily the outcome of that. There's obviously a lot of work ahead of all sides to get there on it and looking for resolution into the spring.
Menno Hulshof : Thank you.
Operator: At this time, we have no questions in the queue. So we will wait a minute to give you the chance to connect with us. [Operator Instructions]. Thank you. The conference has now ended. Please disconnect your lines at this time. And we thank you for your participation.
Subscribe now to gain full access to the earnings summary, 5 years analyst estimates and more exclusive content.
Subscribe NowWARNING: AI-generated summary.
While this is a phenomenal tool that can save you time and provide meaningful insights and key takeaways from the earnings call, it may contain inaccuracies or misinterpretations. For precise information, please refer to the original transcript.
(* All numbers are in thousands)
Fiscal Year | 2014 | 2015 | 2016 | 2017 | 2018 | 2019 | 2020 | 2021 | 2022 | 2023 |
---|---|---|---|---|---|---|---|---|---|---|
Revenue | 20,107,000 | 13,207,000 | 12,282,000 | 17,314,000 | 21,389,000 | 21,353,000 | 13,591,000 | 48,811,000 | 71,765,000 | 52,204,000 |
Cost Of Revenue | 15,843,000 | 11,674,000 | 10,525,000 | 13,890,000 | 17,362,000 | 17,032,000 | 13,391,000 | 39,704,000 | 54,878,000 | 46,044,000 |
Gross Profit | 4,264,000 | 1,533,000 | 1,757,000 | 3,424,000 | 4,027,000 | 4,321,000 | 200,000 | 9,107,000 | 16,887,000 | 6,160,000 |
Research And Development Expenses | 15,000 | 27,000 | 36,000 | 36,000 | 25,000 | 20,000 | 0 | 0 | 0 | 0 |
General And Administrative Expenses | 358,000 | 335,000 | 326,000 | 308,000 | 391,000 | 336,000 | 274,000 | 849,000 | 865,000 | 688,000 |
Selling And Marketing Expenses | 0 | 0 | 0 | 0 | 0 | 0 | 0 | 0 | 0 | 0 |
Selling General And Administrative Expenses | 358,000 | 335,000 | 326,000 | 308,000 | 391,000 | 336,000 | 274,000 | 849,000 | 865,000 | 688,000 |
Other Expenses | 4,000 | -2,000 | -34,000 | 5,000 | 12,000 | 2,166,000 | 2,039,000 | 4,734,000 | 5,670,000 | 63,000 |
Operating Expenses | 2,571,000 | 2,357,000 | 2,059,000 | 3,182,000 | 5,353,000 | 2,522,000 | 2,313,000 | 5,583,000 | 6,535,000 | 688,000 |
Cost And Expenses | 18,414,000 | 14,031,000 | 12,584,000 | 17,072,000 | 22,715,000 | 19,554,000 | 15,704,000 | 45,287,000 | 61,413,000 | 46,732,000 |
Interest Income | 33,000 | 28,000 | 52,000 | 62,000 | 19,000 | 12,000 | 9,000 | 23,000 | 110,000 | 133,000 |
Interest Expense | 427,000 | 454,000 | 471,000 | 619,000 | 595,000 | 547,000 | 511,000 | 1,048,000 | 812,000 | 471,000 |
Depreciation And Amortization | 1,881,000 | 1,914,000 | 959,000 | 1,886,000 | 2,219,000 | 2,274,000 | 2,513,000 | 4,521,000 | 4,538,000 | 4,794,000 |
EBITDA | 3,593,000 | 1,088,000 | 1,170,000 | 2,236,000 | 830,000 | 4,074,000 | 183,000 | 8,201,000 | 15,336,000 | 10,266,000 |
Operating Income | 1,693,000 | -824,000 | -302,000 | 242,000 | -1,326,000 | 1,858,000 | -2,169,000 | 3,879,000 | 10,972,000 | 5,472,000 |
Total Other Income Expenses Net | -86,000 | 1,815,000 | -185,000 | 2,557,000 | -1,992,000 | -461,000 | -1,061,000 | -2,564,000 | -2,241,000 | -483,000 |
income Before Tax | 1,195,000 | 537,000 | -927,000 | 2,216,000 | -3,926,000 | 1,397,000 | -3,230,000 | 1,315,000 | 8,731,000 | 4,989,000 |
Income Tax Expense | 451,000 | -81,000 | -382,000 | -52,000 | -1,010,000 | -797,000 | -851,000 | 728,000 | 2,281,000 | 931,000 |
Net Income | 744,000 | 618,000 | -545,000 | 3,366,000 | -2,669,000 | 2,194,000 | -2,379,000 | 587,000 | 6,450,000 | 4,109,000 |
Eps | 0.980 | 0.750 | -0.650 | 3.050 | -2.170 | 1.790 | -1.940 | 0.290 | 3.290 | 2.150 |
Eps Diluted | 0.980 | 0.750 | -0.650 | 3.050 | -2.170 | 1.780 | -1.940 | 0.290 | 3.200 | 2.120 |
Weighted Average Shares Outstanding | 756,900 | 818,700 | 833,300 | 1,102,500 | 1,228,800 | 1,228,800 | 1,228,900 | 2,016,200 | 1,951,300 | 1,895,487 |
Weighted Average Shares Outstanding Diluted | 757,600 | 818,700 | 833,300 | 1,102,500 | 1,229,200 | 1,229,400 | 1,228,900 | 2,045,100 | 2,006,100 | 1,925,440 |
Currency | CAD | CAD | CAD | CAD | CAD | CAD | CAD | CAD | CAD | CAD |
(* All numbers are in thousands)
Fiscal Year | 2014 | 2015 | 2016 | 2017 | 2018 | 2019 | 2020 | 2021 | 2022 | 2023 |
---|---|---|---|---|---|---|---|---|---|---|
Cash And Cash Equivalents | 883,000 | 4,105,000 | 3,720,000 | 610,000 | 781,000 | 186,000 | 378,000 | 2,873,000 | 4,524,000 | 2,227,000 |
Short Term Investments | 0 | 301,000 | 21,000 | 63,000 | 163,000 | 0 | 0 | 0 | 0 | 0 |
Cash And Short Term Investments | 883,000 | 4,105,000 | 3,720,000 | 610,000 | 781,000 | 186,000 | 378,000 | 2,873,000 | 4,524,000 | 2,227,000 |
Net Receivables | 1,610,000 | 1,257,000 | 1,844,000 | 1,898,000 | 1,238,000 | 1,561,000 | 1,388,000 | 3,892,000 | 3,594,000 | 3,187,000 |
Inventory | 1,224,000 | 810,000 | 1,237,000 | 1,389,000 | 1,013,000 | 1,532,000 | 1,089,000 | 3,919,000 | 4,312,000 | 4,030,000 |
Other Current Assets | 534,000 | 372,000 | 148,000 | 1,175,000 | 208,000 | 5,000 | 121,000 | 1,304,000 | 402,000 | 264,000 |
Total Current Assets | 4,195,000 | 6,473,000 | 6,822,000 | 5,008,000 | 3,195,000 | 3,284,000 | 2,976,000 | 11,988,000 | 12,430,000 | 9,708,000 |
Property Plant Equipment Net | 20,188,000 | 18,910,000 | 18,011,000 | 33,269,000 | 29,483,000 | 29,946,000 | 27,173,000 | 36,955,000 | 39,029,000 | 38,930,000 |
Goodwill | 242,000 | 242,000 | 242,000 | 2,272,000 | 2,272,000 | 2,272,000 | 2,272,000 | 3,473,000 | 2,923,000 | 2,923,000 |
Intangible Assets | 0 | 242,000 | 0 | 0 | 0 | 101,000 | 89,000 | 78,000 | 19,000 | 0 |
Goodwill And Intangible Assets | 242,000 | 242,000 | 242,000 | 2,272,000 | 2,272,000 | 2,272,000 | 2,361,000 | 3,551,000 | 2,942,000 | 2,923,000 |
Long Term Investments | 36,000 | 46,000 | 35,000 | 37,000 | 38,000 | 52,000 | 149,000 | 441,000 | 420,000 | 758,000 |
Tax Assets | -36,000 | 44,000 | 92,000 | 276,000 | 122,000 | -52,000 | 36,000 | 694,000 | 546,000 | 696,000 |
Other Non Current Assets | 70,000 | 76,000 | 56,000 | 71,000 | 64,000 | 211,000 | 75,000 | 475,000 | 502,000 | 900,000 |
Total Non Current Assets | 20,500,000 | 19,318,000 | 18,436,000 | 35,925,000 | 31,979,000 | 32,429,000 | 29,794,000 | 42,116,000 | 43,439,000 | 44,207,000 |
Other Assets | 0 | 0 | 0 | 0 | 0 | 0 | 0 | 0 | 0 | 0 |
Total Assets | 24,695,000 | 25,791,000 | 25,258,000 | 40,933,000 | 35,174,000 | 35,713,000 | 32,770,000 | 54,104,000 | 55,869,000 | 53,915,000 |
Account Payables | 2,588,000 | 1,702,000 | 2,266,000 | 2,635,000 | 1,833,000 | 2,210,000 | 608,000 | 6,353,000 | 6,124,000 | 1,075,000 |
Short Term Debt | 0 | 0 | 50,000 | 0 | 682,000 | 196,000 | 305,000 | 351,000 | 423,000 | 478,000 |
Tax Payables | 357,000 | 133,000 | 112,000 | 129,000 | 17,000 | 17,000 | 0 | 179,000 | 1,211,000 | 88,000 |
Deferred Revenue | 0 | 0 | -50,000 | 0 | 17,000 | 34,000 | 1,410,000 | 179,000 | 0 | 88,000 |
Other Current Liabilities | 369,000 | 156,000 | 405,000 | 1,801,000 | 68,000 | 81,000 | 36,000 | 422,000 | 1,474,000 | 4,569,000 |
Total Current Liabilities | 2,957,000 | 1,858,000 | 2,671,000 | 4,436,000 | 2,600,000 | 2,521,000 | 2,359,000 | 7,305,000 | 8,021,000 | 6,210,000 |
Long Term Debt | 5,458,000 | 6,525,000 | 6,332,000 | 9,513,000 | 8,482,000 | 8,419,000 | 9,014,000 | 15,070,000 | 11,219,000 | 7,108,000 |
Deferred Revenue Non Current | 2,620,000 | 2,059,000 | 1,869,000 | 1,191,000 | 1,604,000 | 1,457,000 | 1,411,000 | 41,000 | 45,000 | 2,359,000 |
Deferred Tax Liabilities Non Current | 3,302,000 | 2,816,000 | 2,585,000 | 5,613,000 | 4,861,000 | 4,032,000 | 3,234,000 | 3,286,000 | 4,283,000 | 4,188,000 |
Other Non Current Liabilities | 172,000 | 142,000 | 211,000 | 199,000 | 159,000 | 83,000 | 45,000 | 4,794,000 | 4,712,000 | 5,338,000 |
Total Non Current Liabilities | 11,552,000 | 11,542,000 | 10,997,000 | 16,516,000 | 15,106,000 | 13,991,000 | 13,704,000 | 23,191,000 | 20,259,000 | 18,993,000 |
Other Liabilities | 0 | 0 | 0 | 0 | 0 | 0 | 0 | 0 | 0 | 0 |
Capital Lease Obligations | 0 | 0 | 0 | 0 | 0 | 1,916,000 | 1,757,000 | 2,957,000 | 2,836,000 | 2,359,000 |
Total Liabilities | 14,509,000 | 13,400,000 | 13,668,000 | 20,952,000 | 17,706,000 | 16,512,000 | 16,063,000 | 30,496,000 | 28,280,000 | 25,203,000 |
Preferred Stock | 0 | 0 | 0 | 0 | 0 | 0 | 0 | 519,000 | 519,000 | 519,000 |
Common Stock | 3,889,000 | 5,534,000 | 5,534,000 | 11,040,000 | 11,040,000 | 11,040,000 | 11,040,000 | 17,016,000 | 16,320,000 | 16,031,000 |
Retained Earnings | 1,599,000 | 1,507,000 | 796,000 | 3,937,000 | 1,023,000 | 2,957,000 | 501,000 | 878,000 | 6,392,000 | 8,913,000 |
Accumulated Other Comprehensive Income Loss | 407,000 | 1,020,000 | 910,000 | 643,000 | 1,038,000 | 827,000 | 775,000 | 684,000 | 1,470,000 | 1,233,000 |
Other Total Stockholders Equity | 4,291,000 | 4,330,000 | 4,350,000 | 4,361,000 | 4,367,000 | 4,377,000 | 4,391,000 | 4,499,000 | 2,875,000 | 2,002,000 |
Total Stockholders Equity | 10,186,000 | 12,391,000 | 11,590,000 | 19,981,000 | 17,468,000 | 19,201,000 | 16,707,000 | 23,596,000 | 27,576,000 | 28,698,000 |
Total Equity | 10,186,000 | 12,391,000 | 11,590,000 | 19,981,000 | 17,468,000 | 19,201,000 | 16,707,000 | 23,608,000 | 27,589,000 | 28,712,000 |
Total Liabilities And Stockholders Equity | 24,695,000 | 25,791,000 | 25,258,000 | 40,933,000 | 35,174,000 | 35,713,000 | 32,770,000 | 54,104,000 | 55,869,000 | 53,915,000 |
Minority Interest | 0 | 0 | 0 | 0 | 0 | 0 | 0 | 12,000 | 13,000 | 14,000 |
Total Liabilities And Total Equity | 24,695,000 | 25,791,000 | 25,258,000 | 40,933,000 | 35,174,000 | 35,713,000 | 32,770,000 | 54,104,000 | 55,869,000 | 53,915,000 |
Total Investments | 36,000 | 46,000 | 35,000 | 37,000 | 38,000 | 52,000 | 149,000 | 441,000 | 420,000 | 758,000 |
Total Debt | 5,458,000 | 6,525,000 | 6,332,000 | 9,513,000 | 9,164,000 | 8,615,000 | 9,319,000 | 15,421,000 | 11,642,000 | 9,945,000 |
Net Debt | 4,575,000 | 2,420,000 | 2,612,000 | 8,903,000 | 8,383,000 | 8,429,000 | 8,941,000 | 12,548,000 | 7,118,000 | 7,718,000 |
Currency | CAD | CAD | CAD | CAD | CAD | CAD | CAD | CAD | CAD | CAD |
(* All numbers are in thousands)
Fiscal Year | 2014 | 2015 | 2016 | 2017 | 2018 | 2019 | 2020 | 2021 | 2022 | 2023 |
---|---|---|---|---|---|---|---|---|---|---|
Net Income | 744,000 | 618,000 | -545,000 | 2,081,000 | -2,970,000 | 2,194,000 | -2,379,000 | 587,000 | 6,450,000 | 4,109,000 |
Depreciation And Amortization | 1,946,000 | 2,114,000 | 1,498,000 | 2,030,000 | 2,131,000 | 2,216,000 | 2,334,000 | 4,322,000 | 4,364,000 | 4,794,000 |
Deferred Income Tax | 359,000 | -264,000 | -209,000 | 583,000 | -794,000 | -814,000 | -838,000 | 452,000 | 642,000 | -250,000 |
Stock Based Compensation | 60,000 | 10,000 | 47,000 | -6,000 | 9,000 | 67,000 | 49,000 | 159,000 | 373,000 | 97,000 |
Change In Working Capital | 47,000 | -217,000 | -562,000 | 145,000 | 480,000 | -439,000 | 126,000 | -1,227,000 | 575,000 | -1,193,000 |
Accounts Receivables | 0 | 0 | 0 | 0 | 0 | 0 | 0 | 0 | 0 | 0 |
Inventory | 0 | 0 | 0 | 0 | 0 | 0 | 0 | 0 | 0 | 0 |
Accounts Payables | 0 | 0 | 0 | 0 | 0 | 0 | 0 | 0 | 0 | 0 |
Other Working Capital | 47,000 | -217,000 | -562,000 | 145,000 | 480,000 | -439,000 | 126,000 | -1,227,000 | 575,000 | -1,193,000 |
Other Non Cash Items | 274,000 | 323,000 | 225,000 | -1,645,000 | 2,288,000 | 389,000 | 106,000 | 524,000 | -1,001,000 | 9,516,000 |
Net Cash Provided By Operating Activities | 3,526,000 | 1,474,000 | 861,000 | 3,059,000 | 2,154,000 | 3,285,000 | 273,000 | 5,919,000 | 11,403,000 | 7,388,000 |
Investments In Property Plant And Equipment | -3,058,000 | -1,714,000 | -1,034,000 | -1,670,000 | -1,377,000 | -1,183,000 | -859,000 | -2,563,000 | -3,758,000 | -4,298,000 |
Acquisitions Net | 0 | -84,000 | 8,000 | -14,565,000 | 1,050,000 | 1,000 | 38,000 | 1,170,000 | 1,117,000 | -503,000 |
Purchases Of Investments | -1,583,000 | 1,714,000 | -1,000 | 0 | 0 | -133,000 | -4,000 | 0 | 0 | 0 |
Sales Maturities Of Investments | 0 | 3,000 | 0 | 0 | 9,000 | 0 | 859,000 | 0 | 0 | 0 |
Other Investing Activites | 291,000 | 969,000 | -44,000 | 3,369,000 | 755,000 | -250,000 | -897,000 | 451,000 | 327,000 | -494,000 |
Net Cash Used For Investing Activites | -4,350,000 | 888,000 | -1,079,000 | -12,866,000 | -613,000 | -1,432,000 | -863,000 | -942,000 | -2,314,000 | -5,295,000 |
Debt Repayment | 0 | -25,000 | 0 | -3,600,000 | -1,164,000 | -2,429,000 | -529,000 | -3,520,000 | -4,451,000 | -1,634,000 |
Common Stock Issued | 28,000 | 1,449,000 | 0 | 2,899,000 | 0 | 0 | 0 | 1,480,000 | 200,000 | -647,000 |
Common Stock Repurchased | 0 | 0 | 0 | 7,443,000 | 0 | 0 | 0 | -265,000 | -2,530,000 | -1,061,000 |
Dividends Paid | -805,000 | -528,000 | -166,000 | -225,000 | -245,000 | -260,000 | -77,000 | -210,000 | -927,000 | -1,026,000 |
Other Financing Activites | -20,000 | -27,000 | -2,000 | -2,000 | -1,000 | 276,000 | 1,443,000 | 8,000 | 32,000 | -592,000 |
Net Cash Used Provided By Financing Activities | -797,000 | 894,000 | -168,000 | 6,515,000 | -1,410,000 | -2,413,000 | 837,000 | -2,507,000 | -7,676,000 | -4,313,000 |
Effect Of Forex Changes On Cash | 52,000 | -34,000 | 1,000 | 182,000 | 40,000 | -35,000 | -55,000 | 25,000 | 238,000 | -77,000 |
Net Change In Cash | -1,569,000 | 3,222,000 | -385,000 | -3,110,000 | 171,000 | -595,000 | 192,000 | 2,495,000 | 1,651,000 | -2,297,000 |
Cash At End Of Period | 883,000 | 4,105,000 | 3,720,000 | 610,000 | 781,000 | 186,000 | 378,000 | 2,873,000 | 4,524,000 | 2,227,000 |
Cash At Beginning Of Period | 2,452,000 | 883,000 | 4,105,000 | 3,720,000 | 610,000 | 781,000 | 186,000 | 378,000 | 2,873,000 | 4,524,000 |
Operating Cash Flow | 3,526,000 | 1,474,000 | 861,000 | 3,059,000 | 2,154,000 | 3,285,000 | 273,000 | 5,919,000 | 11,403,000 | 7,388,000 |
Capital Expenditure | -3,058,000 | -1,714,000 | -1,034,000 | -1,670,000 | -1,377,000 | -1,183,000 | -859,000 | -2,563,000 | -3,758,000 | -4,298,000 |
Free Cash Flow | 468,000 | -240,000 | -173,000 | 1,389,000 | 777,000 | 2,102,000 | -586,000 | 3,356,000 | 7,645,000 | 3,090,000 |
Currency | CAD | CAD | CAD | CAD | CAD | CAD | CAD | CAD | CAD | CAD |
(* All numbers are in thousands)
Revenue (TTM) : | P/S (TTM) : | 0.73 | ||
Net Income (TTM) : | P/E (TTM) : | 10.93 | ||
Enterprise Value (TTM) : | 47.223B | EV/FCF (TTM) : | 8.66 | |
Dividend Yield (TTM) : | 0.04 | Payout Ratio (TTM) : | 0.39 | |
ROE (TTM) : | 0.13 | ROIC (TTM) : | 0.11 | |
SG&A/Revenue (TTM) : | 0.01 | R&D/Revenue (TTM) : | 0 | |
Net Debt (TTM) : | 39.388B | Debt/Equity (TTM) | 0.25 | P/B (TTM) : | 1.38 | Current Ratio (TTM) : | 1.59 |
Trading Metrics:
Open: | 15.85 | Previous Close: | 15.74 | |
Day Low: | 15.76 | Day High: | 15.96 | |
Year Low: | 14.69 | Year High: | 21.9 | |
Price Avg 50: | 16.62 | Price Avg 200: | 18.6 | |
Volume: | 3.306M | Average Volume: | 8.49M |