Exchange: | NYSE |
Market Cap: | 84.973B |
Shares Outstanding: | 401.366M |
Sector: | Industrials | |||||
Industry: | Waste Management | |||||
CEO: | Mr. James C. Fish Jr. | |||||
Full Time Employees: | 48000 | |||||
Address: |
|
|||||
Website: | https://www.wm.com |
Click to read more…
James Fish: Hello, and thank you for standing by. Welcome to WM First Quarter 2024 Earnings Conference Call. [Operator Instructions]
I would now like to hand the conference over to Ed Egl, Senior Director of Investor Relations. You may begin.
Edward Egl: Thank you, Towanda. Good morning, everyone, and thank you for joining us for our first quarter 2024 earnings conference call. With me this morning are Jim Fish, President and Chief Executive Officer; John Morris, Executive Vice President and Chief Operating Officer; and Devina Rankin, Executive Vice President and Chief Financial Officer. You'll hear prepared comments from each of them today. Jim will cover high-level financials and provide a strategic update. John will cover an operating overview, and Devina will cover the details of the financials.
Before we get started, please note that we filed a Form 8-K that includes the earnings press release and is available on our website at www.wm.com. The Form 8-K, the press release and the schedules of the press release include important information.
During the call, you will hear forward-looking statements, which are based on current expectations, projections or opinions about future periods. All forward-looking statements are subject to risks and uncertainties that could cause actual results to differ materially. Some of these risks and uncertainties are discussed in today's press release and in our filings with the SEC, including our most recent Form 10-K.
John will discuss our results in the areas of yield and volume, which unless stated otherwise, are more specifically references to internal revenue growth, or IRG, from yield or volume. During the call, Jim, John and Devina will discuss operating EBITDA, which is income from operations before depreciation and amortization. Any comparisons, unless otherwise stated, will be with the prior year period. Net income, EPS, income from operations and margin, operating EBITDA and margin, and prior period operating expense results have been adjusted to enhance comparability by excluding certain items that management believes do not reflect our fundamental business performance or results of operations.
Additionally, projected future operating EBITDA and margin is anticipated to be adjusted to exclude such items that are not currently determinable but may be significant. These adjusted measures, in addition to free cash flow, are non-GAAP measures. Please refer to the earnings press release and tables, which can be found on the company's website at www.wm.com for reconciliations to the most comparable GAAP measures and additional information about our use of non-GAAP measures and non-GAAP projections.
This call is being recorded and will be available 24 hours a day beginning approximately 1:00 p.m. Eastern Time today. To hear a replay of the call, access the WM website at www.investors.wm.com. Time-sensitive information provided during today's call, which is occurring on April 25, 2024, may no longer be accurate at the time of a replay. Any redistribution, retransmission, or rebroadcast of this call in any form without the express written consent of WM is prohibited.
Now I'll turn the call over to WM's President and CEO, Jim Fish.
James Fish: All right. Thanks, Ed, and thank you all for joining us. The WM team delivered another quarter of strong financial results to start 2024, powered by outstanding operational performance in the collection and disposal business. Total company operating EBITDA grew nearly 15% in the first quarter, and margin expanded 240 basis points, driven by substantial momentum on cost optimization efforts and disciplined execution on our pricing programs.
Last quarter, we said the areas of strength in 2024 would look very similar to those of 2023, and that was definitely the case in Q1. Continued traction on cost optimization led to our third consecutive quarter of operating EBITDA margin above 29.5%, with Q1 coming in at 29.6% in the historically lowest margin quarter of the year. This margin result exceeded our expectations and reflects the tangible benefits of technology on our operating costs, the sustained effectiveness of our pricing strategy and the substantial progress we're delivering on our sustainability initiatives.
It's our track record in these areas that gives us confidence we're positioned to deliver our highest-ever full year operating EBITDA margin between 29.7% and 30.2%, which is more than 100 basis points of expansion from 2023 at the midpoint. Our ability to convert more of each revenue dollar to earnings and free cash flow allows us to raise our prior outlook for both operating EBITDA and free cash flow by $100 million.
As we progress through 2024, we're maintaining our focus on 3 priorities: disciplined pricing across each line of business, leveraging technology to permanently reduce our cost to serve our customers, and executing on our strategic investments in sustainability growth. John and Devina will cover more details on where we're seeing traction within the cost structure and where we have further runway, so I want to spend a few minutes on the other 2 priorities, our pricing strategy and the progress we're making in expanding our sustainability businesses.
Beginning with pricing, we're pleased with the results we've seen from embracing a customer lifetime value model. Our teams are able to leverage customer-specific analysis to understand where a customer is on their journey and design actionable strategies that will extend the customer retention, improve profitability or both. We're confident that we found a winning approach to data-driven decision-making that optimizes price to reflect the value of the services we deliver, the strength of the asset network and our leading commitment to environmental sustainability. Our first quarter results again show that we have the ability to leverage price increases to cover costs and grow margin while also reducing customer churn.
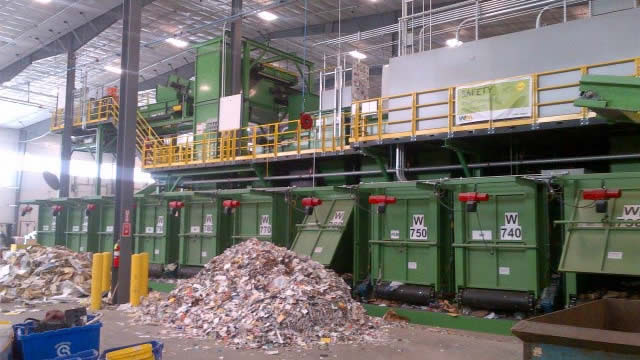
Shifting to our sustainability businesses. During the quarter, we delivered growth projects across the recycling and renewable energy businesses. This includes completing a large recycling upgrade in Germantown, Wisconsin. The updated facility relies on state-of-the-art equipment that reduces labor costs, increases throughput by 20%, up to 60 tons of material per hour, and improves product quality. We have another 9 upgraded facilities scheduled for completion this year, and we'll be opening 3 new recycling facilities and expanding our industry-leading single-stream network even further.
Additionally, we've completed a new renewable natural gas facility this quarter at our DFW landfill in the Dallas-Fort Worth market, and we remain on track to commission another 4 new renewable natural gas facilities in 2024. We're also excited to announce that WM was just named the official sustainability partner of Major League Baseball. WM's work with MLB is the first collaboration of its kind between an environmental services company and a professional sports league team -- sports team league. With this partnership, we have the opportunity to offer services to all 30 MLB clubs in the United States and Canada. We expect to leverage our expertise to build comprehensive plans to improve the environmental impact of Major League Baseball and its clubs.
In closing, I want to thank our WM team for all their hard work during the quarter. I'm immensely proud of their dedication and execution, which have helped achieve such strong financial results. And I'll now turn the call over to John to discuss our operational results.
John Morris: Thanks, Jim, and good morning. In the first quarter, operating expenses as a percentage of revenue improved 210 basis points year-over-year to 60.9%, continuing the positive trend of our disciplined management of operating costs, particularly in our collection business. Through strategic investments in innovative solutions and process optimization, we delivered improvements in operational efficiency, extracted costs, and setting a new standard for managing the middle of the P&L. Combining this strong operating expense performance with the disciplined pricing performance Jim described, we greatly enhanced overall operating EBITDA margins. In the first quarter, operating EBITDA in our collection and disposal business grew $212 million, and margin expanded 310 basis points to 36.6%.
As we continue our journey of automation and optimization, we remain committed to harnessing the power of technology to drive sustainable growth, further reduce costs and improve profitability. In the first quarter of 2024, our continued adoption of technology and automation initiatives led to substantial reductions in both labor costs and repair and maintenance expenses. On the labor front, efficiency in all 3 of our collection lines of business improved meaningfully from the first quarter of 2023 as our implementation continues to gain traction.
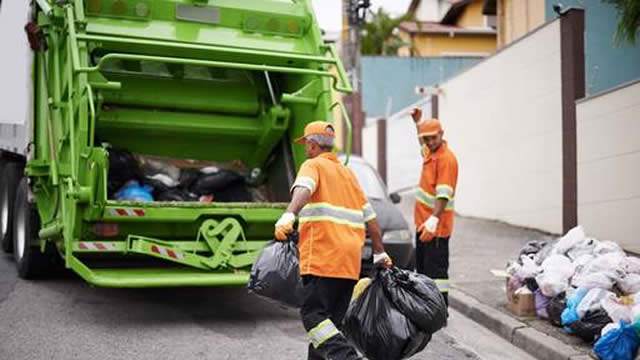
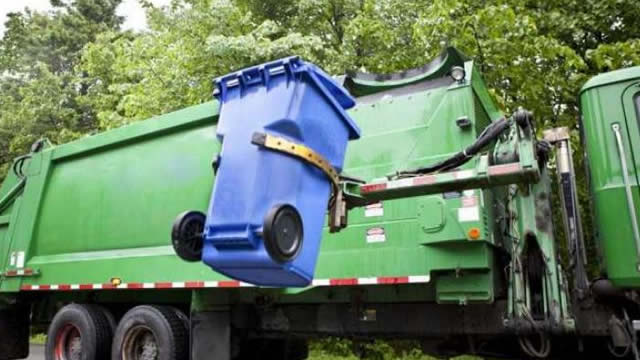
As an example, we're seeing nice improvements in performance from our routing efficiency program, next day optimization, or NDO, in our industrial line of business. This tool allows us to more dynamically route and it improves our efficiency, which is reducing our cost to serve and improving our asset planning. Currently, we have deployed NDO at 92% of our collection sites, and the majority of those are already achieving or exceeding efficiency targets. Additionally, we are achieving great results in the automation of our residential routes. Through Q1, we have automated over 650 routes and removed almost 800 rear load trucks since 2022. This has led to upwards of a 30% efficiency gain and residential EBITDA margins approaching 20%.
The integration of these technology investments, coupled with the benefits of improved driver retention, have resulted in a 135 basis point improvement in labor costs as a percentage of revenue. In the first quarter of 2024, driver turnover improved to about 18%, down from over 22% a year ago. We expect ongoing benefits from continued moderation inflation as well as the investments we're making in our people and processes as we progress through the year.
Turning to repair and maintenance. In the first quarter, repair and maintenance spending decreased year-over-year for the first time in several years, and spending as a percentage of revenue improved 50 basis points. In addition to our strong process discipline, we are also leveraging technology to reduce these costs. These technologies have enabled us to digitize much of our workflow, beginning with all of our technicians who now have portable technology in their hands. These tools facilitate our ability to assign and track work, drive technician efficiency, reduce downtime, and improve asset utilization. Our results are encouraging, and we see further runway to optimize repair and maintenance costs in the future.
In addition to great operating cost performance, we continued to deliver top line growth primarily through disciplined execution on our pricing programs. Our customer lifetime value model continues to drive strong organic revenue growth, and our sales metrics in the quarter are a clear indication of our success in profitably growing the collection and disposal business. Churn was near the lowest rate that we've ever seen at 8.5%. New business improved 16% and continues to outpace lost business. Rollbacks remain in the low double digits. Net service increases remained positive, and our net promoter score improved by almost 12% year-over-year.
Looking at revenue growth, as Jim said, we've seen a strong start to the year in pricing. Volume has been relatively consistent with our original expectations, with the exception of our temporary roll-off business. The softness in this volume category reflects some slowness in the homebuilding and industrial segments of the macro economy. C&D was also impacted with the lapping of volumes related to Hurricane Ian cleanup last year. With that said, our 2 bellwethers for demand, commercial collection and MSW volumes were positive in the quarter, and we also experienced a nice uptick in special waste tons in the quarter.
For the full year, we now expect total revenue growth of between 5% and 5.75%. The revision from our prior expectation is driven by 2 things: the softer temporary roll-off volumes mentioned; and a lower outlook for energy surcharge revenue, given the decline in the average diesel cost relative to our expectations. Our pricing remains on track, and in some lines of business, ahead of our original expectations. Our teams delivered outstanding performance in the first quarter, and I can't thank them enough for all their contributions to our success.
I'll now turn the call over to Devina to discuss our first quarter financial results in further detail.
Devina Rankin: Thanks, John, and good morning. Growing our adjusted operating EBITDA margin by 240 basis points in the first quarter stands out as the best indicator of WM's strong start to the year. As John discussed, the lion's share of this margin expansion came from the optimization of our operating performance in the collection business, with labor efficiency and improved repair and maintenance costs driving a 270 basis point improvement in our total company margin from the core.
Our continued focus on managing our back office spending also contributed 20 basis points of margin expansion in the quarter, with SG&A as a percentage of revenue coming in at 9.5%. Commodity impacts in the quarter largely offset each other as fuel price impacts benefited margin by about 40 basis points, and recycling results decreased margin by about 30 basis points, primarily from the impact of higher recycled commodity pricing in the brokerage business.
The remainder of the margin bridge from Q1 of 2023 to Q1 of 2024 relates to a headwind of about 60 basis points from the combined impacts of incentive compensation and costs incurred by our corporate team to drive adoption of our optimization programs. Our strong margin and earnings, combined with benefits from working capital and lower cash incentive compensation payments, led to robust growth in first quarter cash from operations. We're starting the year strong with cash flow from operations as a percentage of revenue up over 500 basis points to 26.5%, demonstrating the value of our margin expansion to growing the company's cash flow yield.
Capital expenditures totaled $668 million in the quarter, with both capital spending to support the base business and our investments in sustainability growth tracking as planned. Our first quarter free cash flow of $714 million allowed us to invest across all of our capital allocation priorities. We returned more than $550 million to shareholders, paying more than $300 million in dividends and repurchasing $250 million of our stock. In all of this, we still maintained our leverage ratio at our target levels of about 2.6x. With our strong balance sheet and robust earnings and cash flow outlook, we are well positioned to continue our commitment to shareholder returns and long-term growth.
Our effective tax rate in the first quarter was 18.6%, which includes a $37 million benefit from investment tax credits related to the development of renewable natural gas projects. As we noted during our fourth quarter earnings call, our original expectation was that we would see a $120 million benefit in 2024 from the ITC. And we now expect $145 million for the full year. We expect this to benefit both our tax expense and free cash flow in 2024.
As Jim mentioned, our great start to the year has put us on a higher growth trajectory for the full year than we initially anticipated when we gave guidance last quarter. We're confident that our full year operating EBITDA margin results can exceed the very strong 29.6% we achieved in the first quarter, and that is reflected in our increased outlook for 2024 operating EBITDA and margin. As we think about the balance of the year, we anticipate that outsized earnings and margin growth continues in the second and third quarters from our pricing programs and momentum in operating efficiencies that began late in the third quarter of 2023. We continue to expect that growth in our sustainability businesses will be more weighted to the back half of the year as more recycling and renewable natural gas projects begin operations.
Pulling these points together, we want to emphasize that $85 million of the $100 million increase in our operating EBITDA guidance for the year is attributable to our team's strong execution on driving efficiency and the improved cost to serve in the collection business. The remaining $15 million is related to higher recycled commodity price expectations for the year.
To wrap up, we're very pleased to deliver first quarter results that exceeded our own high expectations. Our sustained strong results are a testament to the investments we have made in talent, technology, and assets over the past several years. As always, I want to thank the entire WM team for their focus and dedication to delivering on our commitments to our customers, our communities, and our shareholders.
With that, Towanda, let's open the line for questions.
Operator: [Operator Instructions] Our first question comes from the line of Tyler Brown with Raymond James.
Patrick Brown: So we've got to come back to the stellar margin performance here. So John, if I just look at collection and disposal EBITDA, I think you said it was up $212 million on maybe only $190 million increase in revenue. So I just want to understand how we're getting such incredible flow-through. I mean, it sounds like you're seeing outright deflation in certain items, but maybe just a little more color. And just to be clear, there wasn't, Devina, any sort of onetime accrual reversal or anything else that really impacted the quarter, is that correct?
Devina Rankin: So I'll start with the easy one and confirm there were no accrual reversals or onetime items in the first quarter. The only kind of one-timer that we could point out is actually the loss of the Ian volumes from the prior year that would have been a hill to climb from a margin perspective because, as you know, storm volumes come at high margins. So in fact, the $212 million operating EBITDA growth in the collection and disposal business came with 310 basis points of margin expansion to 36.6% in the collection and disposal business.
John Morris: Yes, a little more color, Tyler. I think a few things are occurring. One is, as I mentioned in my prepared remarks, we're seeing a nice uptick in efficiency in all 3 lines of business from the mid-single digits up to the high single digits for residential. Residential is a really good story. If you look at the table in the back and you see we still traded about 2.9% of the volume down, but we made a good bit more money for the quarter. And I think we're starting to strike a better balance there.
I mentioned in the prepared remarks, residential margins are approaching 20% at the EBITDA line. I think the M&R piece is certainly worthwhile on touching. Last year, we took delivery of about 1,450 trucks. We'll get about 1,800 this year, and that's having a meaningful impact. We felt like we've been chasing M&R costs and labor related to maintenance and repairs.
And for us to actually tamp down costs quarter-over-quarter for the year is something, as I mentioned, we haven't done in a number of years. So I think it's been good efficiency, good cost discipline, our pricing remains robust, especially across the collection and disposal lines. So I think a lot of that came together in Q1. And as Devina mentioned, there really was no one-timer that benefited that. That was just strong execution by the team in the field.
Patrick Brown: Yes, absolutely. Now John, you mentioned 20% resi margin. So can you just remind us where those margins were a few years ago because I believe they're a fair bit lower? And then do you think that those can approach more company average or is this kind of more where you would expect them?
John Morris: Yes. You're testing my memory here, Tyler. But I would say around 10%, 11% is what I recall. And I've said when we started down this journey, if you will, to really rationalize some of the residential business, we wanted residential to compete with commercial and industrial. And while we're not quite there yet, we can see a point where that gets a little bit closer to converging. And I think as that happens, that 2.5% to 3% volume that we've been kind of trading off on average will start to moderate as we get closer to that line.
Patrick Brown: Okay. And then my last one here, Devina, just want to make sure that we kind of have a level set on Q2. So if I look back historically, margins do typically rise, I don't know, 150, 200 basis points sequentially from Q1 to Q2. Just anything to think about why that wouldn't be the case or can you just help us shape the Q2 margin expectation?
Devina Rankin: Yes, I think it's a great question. What I would tell you that we're looking at is a little softer climb from Q1 to Q2 in the normal sequential trends but still a marked improvement from Q1. And coming in, I would say, above 30% pretty handily in Q2 and Q3, in particular. We're currently expecting a little north of 30% in Q2 and potentially even north of 31% in Q3.
James Fish: Tyler, I think part of that, I'm not sure it's that we're seeing any softening. It's just that we're kind of in uncharted territory here in terms of margin, I mean, which is a good thing, but to have a range that includes -- we've talked about numbers starting with a 3 for a long time, and now we finally have a number that starts with a 3 in our guidance range. So we're just being a little bit cautious about it. We certainly saw the trend that you just mentioned from Q1 to Q2 and on, but as did the field. But we feel like we're being maybe a little cautious as we get into some uncharted territory.
Operator: Our next question comes from the line of Bryan Burgmeier with Citi.
Bryan Burgmeier: I believe you've said revised EBITDA guidance is about $85 million in underlying improvement. I guess there would be a headwind from the roll-off volume, so it's maybe even more than $100 million sort of underlying number. Did fuel costs play a role in the EBIT guidance raise? And maybe just from a big picture, what changed over the last 2 to 3 months that maybe allowed you to realize these savings a little bit quicker than you may have anticipated in your original view?
Devina Rankin: Yes, great question. I would tell you in terms of the $85 million, it really is predominantly oriented to 2 things. And one, the biggest driver is our cost efficiency performance and the really strong execution on reducing cost to serve that John's talked so much about on labor and repair and maintenance. The other is the strong execution on price, and that's moderately ahead of the expectations that we had when we came into the year, and we think that will hold for the rest of 2024.
With respect to fuel, it really didn't impact our dollar outlook for the business. What it did impact is our margin outlook for the business. And so the help in margin was 40 basis points in the quarter, and we think that some of that margin help continues into Q2 and Q3. With respect to how we executed in Q1 that gave us confidence in raising the margin outlook, I would tell you, we saw a really strong margin performance in the fourth quarter, really beginning in the third quarter of 2023 but again in Q4.
And because Q4 and Q1, on a seasonally adjusted basis, tend to be lower volume and lower margin quarters for us, we really wanted to preserve some of the upside potential until we saw some of the normal seasonal upticks in our business in the second quarter. But with the strong performance in the first quarter, we really could not wait to reflect that we now expect a full year that will hit that 100 basis points of margin expansion.
James Fish: I mean, I think the risk there, Devina, was as we discussed it, Bryan, the risk was, with such a strong performance, if we didn't raise guidance, there might have been questions on this call about, so is there something that we're not seeing that you're seeing? Is there something that you had that benefited you? And of course, Devina already answered that. The answer was no. But what we were a little concerned, if we didn't raise margin after such a huge margin performance that, by the way, was on the heels of 2 other quarters, that you might start asking questions about it, are we missing something? And you're not missing anything. We're just improving the margin that much.
Bryan Burgmeier: Got it. Last question for me. I know we're waiting for a little bit more detail on the investment tax credits. And it seems like you put a comment in the press release, $37 million in 1Q, $145 million for the year. I guess I'm just curious if that was kind of in line with your original expectations. And are we still kind of tracking for like a $300 million benefit over the course of your investments through 2026? Good luck in the quarter. I'll turn it over.
Devina Rankin: Great, thank you. So our original expectations for 2024 were $120 million, so our current outlook of $145 million is a $25 million increase of the ITC benefit in 2024 specifically. With regard to our full outlook for ITC capture over the development plan that we have outlined, we are tracking toward the high end of the original range of $250 million to $300 million.
Operator: Our next question comes from the line of Jerry Revich with Goldman Sachs.
Jerry Revich: Really nice performance this quarter. And over time, you folks have consistently expanded margins by 20, 30 basis points per year almost like clockwork. And I'm wondering, as we think about the long-term plan from here, should we be thinking about 2025 as a lower year of margin expansion because we're getting such good price/cost spread this year? Or does that not factor into how you're thinking about the longer-term plan that you folks unveiled, what, 6 or 9 months ago?
Devina Rankin: It's a great question. And while it's a little too early for us to be looking to specifically set guidance for '25, I do agree with you that there are some fundamentals that would make us a little more cautious to effectively repeating a 20 to 30 basis point margin expansion year-on-year. But that being said, I would tell you there are some fundamentals with respect to what we're seeing that we know have additional runway and growth, and those fundamentals really come on the labor and repair and maintenance side.
So repair and maintenance, long term, has been below 9% of revenue. In Q1, we're at 9.5%. So 50 basis points of savings across the year is $100 million of EBITDA. So if we could see ourselves get there, I do think that, that's one of the things that could give us some incremental traction above that 20 to 30 basis points long term. The one thing that we don't really have clarity on yet, but we -- based on what we know today will be a headwind, is that the alternative fuel tax credits will expire at the end of 2024. And that's been about a $55 million benefit to our operating expenses on an annual basis. So that could be a headwind that would tamp down our margin for the years ahead. But we really do think there's strong traction in labor and repair and maintenance that will more than offset that headwind.
James Fish: Jerry, I think there's some -- it's always going to be a combination of headwinds and tailwinds. Tara's here. She can talk about the fact that we have a bit of a tailwind next year when it comes to recycled shutdowns. I mean, this year, we're going to see somewhere in the neighborhood of $30 million, maybe a little less as an impact, a negative impact on us from shutting down these recycled plants while we rebuild them. That drops off pretty significantly next year. So you probably have somewhere in the neighborhood of a $25 million pickup or tailwind next year.
The other thing that John and I and Devina have all talked a lot about is this kind of reduction in heads but doing it in a low-impact way, so it's just through attrition. And when we think about that, as I look at our actual headcount from '22, it's down over 2,000 people. And none of those people -- we're not -- none of those people were RIF-ed. We're not going through an arbitrary reduction in force. That's just choosing to not replace folks, and we've given about 4 or 5 different categories where that happens.
But several of those categories are still not complete. One of them John has talked about, which is the shift from rear load to automated side load. Each time you do that, there is a person that is no longer needed on the back of the truck. As you can imagine, we have pretty high turnover there so we just take advantage of that through attrition. Similarly, in Tara's shop and the recycling business, as we rebuild these plants, we're seeing somewhere between a 30% and 40% reduction in labor costs, and so there are some related heads that come out with that.
So we still, even in '24, have another probably, John, 1,200 total heads that will come out if you combine those 2 categories. And that takes us from 2,000 to 3,200, 3,300. So that's a big, big part of this is that we're doing this in a more labor efficient way, and it really is coming to fruition.
Jerry Revich: Super. And Jim, maybe just to expand on the recycling part of that conversation. So we have the plant downtime this year but also the returns on the CapEx that you folks are delivering. So what level of improvement are you anticipating '25 versus '24? Correct me if I'm wrong, I think the original plan called for something like a $90 million year-over-year benefit. Is that still the plan for '25 versus '24 so we get that on top of the $25 million swing that you spoke to?
Tara Hemmer: I can speak to that. So as we mentioned, we have 13 plants that we expect to bring online this year and another 13 next year, and those remain on track today. If you think about our exit in 2024 related to headcount, we'll be at a point where we've gotten 70% of the headcount out by the end of 2024 on the automation journey. So we should see not just a pickup from shutdown costs but also from the benefit of 30% improvement in labor costs and operating expenses from those plants.
It's a great example of how we're able to bring to life in some of these communities. We were just up at Germantown last week for the grand opening celebration. And bringing in more capacity is a great way to differentiate WM in these key markets that we operate in.
James Fish: So to use a baseball analogy since we just signed a deal with Major League Baseball, Tara, we'll be in the seventh inning?
Tara Hemmer: Exactly, seventh inning stretch.
James Fish: All right, perfect.
Operator: Our next question comes from the line of Sabahat Khan with RBC Capital Markets.
Sabahat Khan: A lot of color there on kind of the tangible labor savings. Is there any way to quantify some of the operational efficiencies or savings in terms of the technology investments that you're making, some of the data analytics tools just in terms of how much bps you might expect over 1, 3 years and what you're kind of seeing relative to expectations?
John Morris: Well, I think the one line we can certainly look at, I think Devina had some of that in her prepared remarks, is kind of what the ratio is of direct labor to revenue. We saw a nice improvement there. I think that's a combination of 2 things: one, we've continued to be very disciplined about pricing. We've said we're playing the long game here, and I comment about customer lifetime value. So I think part of the benefit is we've continued to drive quality revenue at the top line across all the collection lines.
And frankly, the post-collection line is worth noting it didn't come out, but this was our best quarter in history from a landfill pricing standpoint and a transfer station perspective. So the top line is strong. But I mentioned efficiency. And part of what's driving that mid to high single-digit efficiency is the use of technology to drive efficiency.
Our turnover number's worth commenting on again because we are at all-time lows at about 18%. And that takes a lot of pressure off if you think about the cost, the friction cost of training folks, putting second people in trucks and all those things. So that's another part of it. And we're down about 750 routes year-over-year. And you can look at our volume. Part of it is being driven by the automation of residential. But the rest of it is we are less capital-intensive for basically doing more work in the commercial and industrial lines year-over-year.
James Fish: John, you mentioned also, and John mentioned that in his script that 90% of the roll-off line of business has been rolled out on this [ India ], which is the term for our optimization model. But we haven't rolled out commercial and haven't rolled out residential on that model yet, so we still have a fair amount of room to go there. And all of this is -- it was really 4, 5 years ago, an admission by us, that our routing was not as efficient as it could be if we used -- truly used technology to benefit that. I think that's probably the case across the entire industry. And so 4 or 5 years ago, we decided that, that had to change and now you're seeing the fruits of that.
Sabahat Khan: All right, great. And then I guess, as you think about optimizing and I think pricing and some of the data analytics you're using to figure out the right price for the right customer based on their value, do you believe, based on the work you've done to date, that the model is at the right place? I'm sure there's an element of test and learn. But do you think you've got the right factors? What's sort of your data telling you in terms of how well that model is working?
James Fish: I think we -- look, there's always room for improvement so I would not tell you that we're -- that we've perfected this. But from when I was a price guy back in the early 2000s, it's night and day. I think the team has done a spectacular job using data and analytics to their benefit and making sure that we are looking at the customer who really drives the decision as opposed to driving the decision just purely based on a number that we needed to hit in our price metrics. So I would tell you that we've made a ton of progress there. Are we perfect? We're not, but so much better than we used to be.
John Morris: I would say, Jim, our customer metrics, I commented on, that's really the barometer. When you look at our gross and net PIs, when you look at customer churn, service increases and decrease and our net promoter score, I think those are all the measurements sort of right to the equal sign of how effective our program is.
Sabahat Khan: And then just one quick one, I guess, on the revenue guidance update there. I think just wanted to get a little bit more color on the softer roll-off portion. It sounds like bit of homebuilding and industrial slowdown. Is that just a change in the view of how the macro is going to evolve for the rest of the year based on what you've seen year-to-date? Or was there any specific issue that came up in the industry? Just want to get more color on the evolution of the view on the roll-off and the macro.
John Morris: Yes. I think the takeaway here is we were guiding to about 1% volume and now we're probably down to about 0.5%. So it's a move but it's not that meaningful of a move. It's early in the year, too. I would tell you that when we were preparing for today, we're obviously looking at Q1, Q4. And we've seen a little bit of an uptick here in April. It looks like it's getting a tad better.
I think the bigger news is aside from a little softness in the housing sector, which we spoke to, I think the rest of the business is still performing well. When you look at our post-collection volume, particularly MSW and our commercial volume still performing well, that's what really gives us conviction about the $100 million for the balance of the year that Devina commented on.
Operator: Our next question comes from the line of Toni Kaplan with Morgan Stanley.
Hilary Lee: This is Hilary Lee on for Toni. Congrats on the quarter, guys. Just want to touch on pricing a little bit. So when you said earlier that you expect price to hold for the rest of the year, does that mean you're expecting core price to be closer to around that 7% rather than the 6% you said last quarter?
James Fish: Well, we did say for price that -- and I mentioned it earlier that we actually exceeded a little bit of our expectations. So we're not changing anything for the year, but your point is well taken, that's -- that we actually ended up a little bit higher than the full year guidance and so that's a positive for us. At this point, we'll leave it where we originally set it, though.
Hilary Lee: Got it. And as a follow-up, just wanted to touch on the sustainability. I know last quarter, you talked about having about $150 million of EBITDA coming from the sustainability investments for 2024. Just wondering if you would be able to kind of give us a little bit of information on potentially the cadence or kind of the split between R&D and recycling. Any details would help.
Tara Hemmer: Sure. The $15 million increase that Devina referenced, the most significant portion of that is from recycling and really from commodity prices and not a whole lot of benefit from the renewable energy business. And the reason for that is we, today, have about 85% of our volume locked in, in either short, mid, or long-term offtake at this point, which is an increase from what we had said during our last call, which was roughly 2/3.
So while RIN prices are increasing and we saw -- we've seen increased RIN prices, we've also seen some offsetting items on really natural gas prices and power prices related to a more mild winter that we had this year.
Devina Rankin: And in terms of the cadence of when that shows up, it will be more heavily weighted toward Q3 and Q4 because our time line with regard to the incremental projects that are coming online is weighted toward the back half of the year.
Hilary Lee: Congrats again on the quarter.
Operator: Our next question comes from the line of Michael Hoffman with Stifel.
Michael Hoffman: Devina, Jim, John, do we have a new baseline in margins? We can now say 29.5% to 30% is the new baseline and we'll grow from there?
Devina Rankin: There's certainly nothing in the current year that tells us that this isn't the right baseline, so I do think that, that's a great way to look at it, Michael. Everything that you know about the WM culture is one that's focused on the customer and focused on continuous improvement. And I think those 2 things shone through and that commitment won't stop. So I do think the new baseline can go upward from here.
Michael Hoffman: And then everybody, of course, is trying to figure out how they're supposed to model '25 already. But if we -- but you have to have some assumptions, so like what we think inflation is, what we think GDP is. If we said 3% inflation and 2.5% GDP, your price/cost spread on that number should still produce probably 30 basis points of margin. And then you still have everything John and Tara, that's a mouthful. This is my sixth earnings call in the last 7 hours, so it's running together. All that self-help still left, too. Is that the right way to think about, without putting the number on the increment, I start with 30% price/cost spread management, somewhere between 29.5% and 30%, add that 30% to it, and then I get self-help.
Devina Rankin: I think that you've characterized it well in terms of self-help. I think it's that continuous improvement mindset as well as some of the things that were out of our control like truck deliveries. For a while, we've really moved past that headwind and are starting to see strong traction from getting the assets that we need to run our business.
James Fish: I look at it as continuous improvement, Michael. Self-help kind of sounds like I was an alcoholic and I'm coming off the bottle.
Michael Hoffman: I didn't mean it pejoratively. I think of it as things that you can do, that you control as opposed to relying on the macro.
James Fish: I know. Just giving you a little bit of a hard time.
Michael Hoffman: But what are you drinking these days? So cadence, Devina, in 4Q, you said first half, second half EBITDA growth should be about equal. Does anything change with the performance at this juncture?
Devina Rankin: The only thing I would say is that first half solid waste growth is even greater than what we had projected because what you saw is the strong margin performance and growth from the solid waste business really showed up more quickly than we were expecting. So that solid waste lift comes more heavily weighted toward the first half of the year.
Michael Hoffman: So a little more weighting than slightly as opposed to evenly?
Devina Rankin: Correct.
Michael Hoffman: Okay. And on the $85 million of operational leverage, how much of that is the ITC benefit that runs through gross margin instead of through the tax line?
Devina Rankin: None of it, zero. All of it's in the tax line.
Michael Hoffman: Perfect. And then given the improvement in retention, I would assume the safety metrics are also at all-time goods?
John Morris: Yes, that's a good point, Michael. I mean, take that sort of a leading indicator of what we can expect from safety. But there's a clear distinction between somebody who's tenured in the seat and somebody who's not. And that's not a critique of folks who are new in the seat. It's just a matter of having that experience. And we do see a pretty wide spread between those who are tenured in operating a vehicle and those who are not. So as we continue to hold that number down, we expect the safety results to continue to improve as well.
James Fish: By the way, Michael, the most -- we've said before, but the most important metric in this move from rear load to ASL is a safety metric. It's not a financial metric. Financials obviously are better, but it's a safety metric. And so as we continue to take a person from the back of the truck, which is the most dangerous place, honestly, in our entire operation, behind the truck, as we continue to move that person inside the cab, that will benefit us significantly.
Michael Hoffman: Yes. And the last one for me. One of the powers of the roll-off business is that when it does slow, you park equipment, reposition drivers and raise prices. Is there anything different in this cycle?
John Morris: No. Michael, I think you said it well. I mean, that's something we've been very focused on. Some of the technologies we've implemented over the last handful of quarters really starting to show benefits is really around capacity planning and making sure that we can see around the corner using, frankly, data and analytics that we didn't use a handful of years ago to be very predictive with a very small deviation between what history would tell us we need to plan from what we actually plan for, and we're still getting better at that.
Michael Hoffman: So we might see a revenue hit for volume but you might not see much, if anything, in EBITDA because you make those adjustments so quickly. That's part of the point.
John Morris: We talked about the volume being down for the quarter, Michael, but I think the revenue, it was off about $7 million. So when you look at the amount of volume versus what we got from a revenue quality standpoint, from a margin standpoint, from that perspective, it was a good trade-off.
Operator: Our next question comes from the line of Stephanie Moore with Jefferies.
Stephanie Benjamin Moore: I wanted to maybe circle back on the automation opportunity within residential, apologize if I've missed it, but where are we left in terms of automating some of those routes, automated side-arms and the like, what has been complete? What is left to do? And then I think you did mention the opportunity for greater automation on the commercial side as well. So maybe if you could just expand on that opportunity and the time line of starting to really kind of accelerate those efforts.
John Morris: I did comment briefly on that. We've taken about 800 rear load trucks out of the fleet and about 650 rear load routes since we really started earnestly pursuing this in early Q2. We've got roughly another 350 to 400 routes we have targeted this year, and I say 350 to 400 because that has to do with some truck deliveries. And that probably -- when we get done in '24, that probably puts us in about the sixth inning, if you want to continue with the baseball analogy. We still got some room to go there. So hopefully, that clarifies that.
James Fish: And in commercial?
John Morris: Commercial. I think on the commercial side, where we have -- continue to see benefit is really driving efficiency, and Jim commented on it. We've got some more sophisticated, frankly, tools to help us route our vehicles and, in some cases, the dynamic element is where we think -- although it's less in commercial than roll-off, there is a dynamic element to commercial and our ability to real-time route that. And to route around real-time traffic is another capability that we are just putting in, in the system now.
Stephanie Benjamin Moore: Got it. And then just to maybe touch on the labor aspect, so clearly seeing an incredible improvement in labor. You called out turnover. So I guess if we could kind of break out the components, clearly, turnover is at a significantly higher level. Are you seeing actual labor costs come down? Is this -- is the average employee being more productive because you're seeing more tenure? If you could just kind of maybe explain what we're seeing on the labor side or the fact -- is there a deflationary element of this as well?
Devina Rankin: Yes, it's a great question. And I would tell you in terms of the inflationary cost pressure on wages, we have seen that soften. We're currently at about 5% wage inflation for our driver population, and that's certainly down from low double digits at its peak. So that's the labor component that's associated with inflation.
The other piece is, John really talked about them, whether it's the route optimization work, efficiency, driver and technician retention, improved turnover. And then truck deliveries helps on that front, too, because ultimately, that is their office and they feel appreciated and like they have the assets that they need in order to serve the customer. And so we're seeing help in each of those aspects of the business.
I think that the widening impact in terms of margin expansion from labor in the operating expense category is most significant on the efficiency front but certainly helps on the improved inflation headwind.
Operator: Our next question comes from the line of Tobey Sommer with Truist.
Jack Wilson: This is Jack Wilson on for Tobey. Can you maybe speak to sort of the other benefits of the recycling facility upgrades other than sort of the potential to remove some positions? And is that capacity-based or is that some efficiency gains we'll be seeing?
Tara Hemmer: Sure. There's really 2 other components. The first is we really improved the quality of material that's generated so we're able to sell some of the material at higher price points. So really moving mixed paper into higher grades, and we get a price premium. That's been demonstrated in all of the automated MRFs that we brought online.
And then also we're increasing the capacity at these facilities quite significantly, so we're able to bring in more volume. And that's going to be a great example of how we can tie that back to our customers and grow recycling volumes and also grow our collection volumes, too.
Operator: Our next question comes from the line of Noah Kaye with Oppenheimer.
Noah Kaye: So the really strong flow-through into free cash flow performance, can we just walk through how we get that improvement of $100 million? It sounds like, obviously, there's the operating performance, maybe also some tax items going on and then some working capital improvements. Just how do we think about the delta?
Devina Rankin: Yes. So it really is an EBITDA story. And the EBITDA dollar growth that we are projecting of $100 million is expected to flow directly through. And the reason you don't have a tax offset there from the higher earnings is because we have $25 million of incremental expected ITCs. So those 2 kind of offset each other such that our outlook for cash taxes is effectively flat.
So EBITDA is what drove our outlook for $100 million increase in free cash flow for the year. I would tell you, I do expect some upside from that potentially because we had such a strong quarter from a working capital perspective and certainly stronger than we expected. So in my experience, you have to wait to see whether that's timing-related, and so we didn't incorporate any working capital benefit in the revised guidance.
Noah Kaye: That's really clear and helpful. And then a question that might not have a clear answer. But on PFAS, it seems like the EPA regulations kind of played out as expected, although pretty inequitable to have exemptions for municipal but not private solid waste it seems. I guess 2 things: one, can you talk about your expectations for cost impacts if everything kind of stands up the way it does as written today? And two, your thoughts on how that might potentially change, whether with congressional action or any further action on the part of EPA.
John Morris: So Noah, I would tell you, we're obviously -- that's a topic we're following, I'm sure the whole industry is following very closely. There was some language in the last release from EPA that had some language about some protection for the landfill. But candidly, it didn't go far enough to give us a lot of security around the topic, so we're going to stay close to that. And as you can imagine, we're very vocal in all the right offices to make sure that we find a pragmatic approach to handling this because it is an issue that obviously has to be managed.
I would tell you that landfills, both sub C and D are still considered to be very viable, long-term, responsible repositories for PFAS, so we still see it as an opportunity. The circle designation, which give us a little bit more latitude on the super fund side, actually, we see that as an opportunity for some of, in particular, DoD sites that are going to start getting cleaned up. We're already doing some of that work now.
And then lastly, I would tell you on the cost side, a little hard to predict now. What I will say is very encouraging, though, when I was with our post-collection team in the last few days, there's a lot going on in the technology front that we think we can bolt on to our post-collection sites to be able to really effectively manage that at a cost that we can pass on to the customer. So hopefully, I captured it all.
Operator: Our next question comes from the line of Tony Bancroft with Gabelli Funds.
George Bancroft: Congratulations, Jim, Devina, and John, the team on a great quarter. Just longer term, what are you -- is there -- are there any opportunities maybe through something transformational, either be it like these large regionals that are still around that everyone talks about or maybe something in a different line of business? What is your sort of longer-term outlook on the business and any interest in other -- maybe other opportunities?
James Fish: Yes. I think there certainly are always opportunities for us. Over the last couple of years, we've been focused on internal opportunities. We did say that with respect to M&A that we were sticking with our guidance that we've given in the last couple of years of $100 million to $200 million. But that there was some opportunity and the pipeline looked pretty strong. So I do think there's opportunity for us to grow both organically, as we've talked a lot on this call, but also inorganically, and we're just going to make sure it's the right acquisition that we feel like has a good strategic long-term prospect.
Operator: I'm showing no further questions in the queue. I would now like to turn the call back over to Jim Fish for closing remarks.
James Fish: Okay. Well, thank you all for joining us today. We appreciate your participation, and we look forward to talking to you next quarter.
Operator: Ladies and gentlemen, this concludes today's conference call. Thank you for your participation. You may now disconnect.
Subscribe now to gain full access to the earnings summary, 5 years analyst estimates and more exclusive content.
Subscribe NowWARNING: AI-generated summary.
While this is a phenomenal tool that can save you time and provide meaningful insights and key takeaways from the earnings call, it may contain inaccuracies or misinterpretations. For precise information, please refer to the original transcript.
(* All numbers are in thousands)
Fiscal Year | 2014 | 2015 | 2016 | 2017 | 2018 | 2019 | 2020 | 2021 | 2022 | 2023 |
---|---|---|---|---|---|---|---|---|---|---|
Revenue | 13,996,000 | 12,961,000 | 13,609,000 | 14,485,000 | 14,914,000 | 15,455,000 | 15,218,000 | 17,931,000 | 19,698,000 | 20,426,000 |
Cost Of Revenue | 9,002,000 | 8,231,000 | 8,486,000 | 9,021,000 | 9,249,000 | 9,496,000 | 9,341,000 | 11,111,000 | 12,294,000 | 12,606,000 |
Gross Profit | 4,994,000 | 4,730,000 | 5,123,000 | 5,464,000 | 5,665,000 | 5,959,000 | 5,877,000 | 6,820,000 | 7,404,000 | 7,820,000 |
Research And Development Expenses | 0 | 0 | 0 | 0 | 0 | 0 | 0 | 0 | 0 | 0 |
General And Administrative Expenses | 1,440,000 | 1,307,000 | 1,370,000 | 1,426,000 | 1,400,000 | 1,593,000 | 1,674,000 | 1,827,000 | 1,888,000 | 1,870,000 |
Selling And Marketing Expenses | 41,000 | 36,000 | 40,000 | 42,000 | 53,000 | 38,000 | 54,000 | 37,000 | 50,000 | 0 |
Selling General And Administrative Expenses | 1,481,000 | 1,343,000 | 1,410,000 | 1,468,000 | 1,453,000 | 1,631,000 | 1,728,000 | 1,864,000 | 1,938,000 | 1,870,000 |
Other Expenses | -29,000 | -7,000 | -50,000 | -8,000 | 2,000 | 1,574,000 | 1,671,000 | 1,999,000 | 2,038,000 | 6,000 |
Operating Expenses | 2,773,000 | 2,588,000 | 2,711,000 | 2,844,000 | 2,930,000 | 3,205,000 | 3,399,000 | 3,863,000 | 3,976,000 | 3,997,000 |
Cost And Expenses | 11,775,000 | 10,819,000 | 11,197,000 | 11,865,000 | 12,179,000 | 12,701,000 | 12,740,000 | 14,974,000 | 16,270,000 | 16,603,000 |
Interest Income | 5,000 | 0 | 0 | 0 | 0 | 411,000 | 425,000 | 365,000 | 378,000 | 0 |
Interest Expense | 471,000 | 385,000 | 376,000 | 363,000 | 374,000 | 411,000 | 425,000 | 365,000 | 378,000 | 500,000 |
Depreciation And Amortization | 1,292,000 | 1,245,000 | 1,392,000 | 1,468,000 | 1,572,000 | 1,672,000 | 1,774,000 | 2,110,000 | 2,150,000 | 2,201,000 |
EBITDA | 3,436,000 | 3,342,000 | 3,619,000 | 3,920,000 | 4,173,000 | 4,223,000 | 4,086,000 | 4,925,000 | 5,397,000 | 5,840,000 |
Operating Income | 2,299,000 | 2,045,000 | 2,296,000 | 2,636,000 | 2,789,000 | 2,706,000 | 2,434,000 | 2,965,000 | 3,365,000 | 3,575,000 |
Total Other Income Expenses Net | -4,000 | -697,000 | -214,000 | -66,000 | 15,000 | -601,000 | -541,000 | -616,000 | -447,000 | -302,000 |
income Before Tax | 1,751,000 | 1,060,000 | 1,822,000 | 2,191,000 | 2,376,000 | 2,105,000 | 1,893,000 | 2,349,000 | 2,918,000 | 3,021,000 |
Income Tax Expense | 413,000 | 308,000 | 642,000 | 242,000 | 453,000 | 434,000 | 397,000 | 532,000 | 678,000 | 745,000 |
Net Income | 1,298,000 | 753,000 | 1,182,000 | 1,949,000 | 1,925,000 | 1,670,000 | 1,496,000 | 1,816,000 | 2,238,000 | 2,304,000 |
Eps | 2.800 | 1.660 | 2.660 | 4.440 | 4.490 | 3.930 | 3.540 | 4.320 | 5.420 | 5.690 |
Eps Diluted | 2.790 | 1.650 | 2.650 | 4.410 | 4.450 | 3.910 | 3.520 | 4.290 | 5.390 | 5.660 |
Weighted Average Shares Outstanding | 462,600 | 452,700 | 443,500 | 438,800 | 429,100 | 424,600 | 423,000 | 420,400 | 412,800 | 404,900 |
Weighted Average Shares Outstanding Diluted | 465,600 | 455,900 | 446,500 | 441,900 | 432,200 | 427,500 | 425,100 | 422,900 | 415,000 | 406,900 |
Currency | USD | USD | USD | USD | USD | USD | USD | USD | USD | USD |
(* All numbers are in thousands)
Fiscal Year | 2014 | 2015 | 2016 | 2017 | 2018 | 2019 | 2020 | 2021 | 2022 | 2023 |
---|---|---|---|---|---|---|---|---|---|---|
Cash And Cash Equivalents | 1,307,000 | 39,000 | 32,000 | 22,000 | 61,000 | 3,561,000 | 553,000 | 118,000 | 351,000 | 458,000 |
Short Term Investments | 0 | 0 | 0 | 0 | 0 | 0 | 0 | 0 | 0 | 0 |
Cash And Short Term Investments | 1,307,000 | 39,000 | 32,000 | 22,000 | 61,000 | 3,561,000 | 553,000 | 118,000 | 351,000 | 458,000 |
Net Receivables | 1,937,000 | 2,094,000 | 2,132,000 | 2,374,000 | 2,275,000 | 2,319,000 | 2,624,000 | 2,546,000 | 2,752,000 | 2,870,000 |
Inventory | 106,000 | 92,000 | 90,000 | 96,000 | 102,000 | 106,000 | 124,000 | 135,000 | 164,000 | 173,000 |
Other Current Assets | 397,000 | 212,000 | 212,000 | 228,000 | 309,000 | 329,000 | 363,000 | 405,000 | 448,000 | 303,000 |
Total Current Assets | 3,641,000 | 2,345,000 | 2,376,000 | 2,624,000 | 2,645,000 | 6,209,000 | 3,540,000 | 3,069,000 | 3,551,000 | 3,804,000 |
Property Plant Equipment Net | 10,657,000 | 10,665,000 | 10,950,000 | 11,559,000 | 11,942,000 | 12,893,000 | 14,148,000 | 14,419,000 | 15,719,000 | 16,968,000 |
Goodwill | 5,740,000 | 5,984,000 | 6,215,000 | 6,247,000 | 6,430,000 | 6,532,000 | 8,994,000 | 9,028,000 | 9,323,000 | 9,254,000 |
Intangible Assets | 440,000 | 477,000 | 591,000 | 547,000 | 572,000 | 521,000 | 1,024,000 | 898,000 | 827,000 | 759,000 |
Goodwill And Intangible Assets | 6,180,000 | 6,461,000 | 6,806,000 | 6,794,000 | 7,002,000 | 7,053,000 | 10,018,000 | 9,926,000 | 10,150,000 | 10,013,000 |
Long Term Investments | 408,000 | 360,000 | 320,000 | 269,000 | 406,000 | 483,000 | 426,000 | 432,000 | 578,000 | 606,000 |
Tax Assets | 115,000 | 1,391,000 | 1,482,000 | 1,248,000 | 1,291,000 | -483,000 | -426,000 | -432,000 | 1,733,000 | 1,826,000 |
Other Non Current Assets | 411,000 | -803,000 | -1,075,000 | -665,000 | -636,000 | 1,588,000 | 1,639,000 | 1,683,000 | -364,000 | -394,000 |
Total Non Current Assets | 17,771,000 | 18,074,000 | 18,483,000 | 19,205,000 | 20,005,000 | 21,534,000 | 25,805,000 | 26,028,000 | 27,816,000 | 29,019,000 |
Other Assets | 0 | 0 | 0 | 0 | 0 | 0 | 0 | 0 | 0 | 0 |
Total Assets | 21,412,000 | 20,419,000 | 20,859,000 | 21,829,000 | 22,650,000 | 27,743,000 | 29,345,000 | 29,097,000 | 31,367,000 | 32,823,000 |
Account Payables | 2,395,000 | 2,257,000 | 2,377,000 | 2,523,000 | 1,037,000 | 1,065,000 | 1,121,000 | 1,375,000 | 1,766,000 | 1,709,000 |
Short Term Debt | 1,090,000 | 253,000 | 417,000 | 739,000 | 432,000 | 218,000 | 551,000 | 708,000 | 414,000 | 334,000 |
Tax Payables | 0 | 0 | 0 | 0 | 0 | 0 | 0 | 0 | 0 | 0 |
Deferred Revenue | 475,000 | 472,000 | 493,000 | 503,000 | 522,000 | 534,000 | 539,000 | 571,000 | 589,000 | 578,000 |
Other Current Liabilities | -475,000 | -472,000 | -493,000 | -503,000 | 1,117,000 | 1,327,000 | 1,342,000 | 1,428,000 | 1,625,000 | 1,605,000 |
Total Current Liabilities | 3,485,000 | 2,510,000 | 2,794,000 | 3,262,000 | 3,108,000 | 3,144,000 | 3,553,000 | 4,082,000 | 4,394,000 | 4,226,000 |
Long Term Debt | 8,345,000 | 8,728,000 | 8,893,000 | 8,752,000 | 9,594,000 | 13,280,000 | 13,259,000 | 12,697,000 | 14,570,000 | 15,895,000 |
Deferred Revenue Non Current | -1,453,000 | -1,391,000 | -1,482,000 | -1,248,000 | -1,291,000 | -1,407,000 | -1,806,000 | -1,694,000 | 1,733,000 | 2,888,000 |
Deferred Tax Liabilities Non Current | 1,453,000 | 1,391,000 | 1,482,000 | 1,248,000 | 1,291,000 | 1,407,000 | 1,806,000 | 1,694,000 | 1,733,000 | 1,826,000 |
Other Non Current Liabilities | 3,693,000 | 3,814,000 | 3,852,000 | 3,773,000 | 3,672,000 | 4,249,000 | 5,079,000 | 5,192,000 | 2,073,000 | 1,092,000 |
Total Non Current Liabilities | 12,038,000 | 12,542,000 | 12,745,000 | 12,525,000 | 13,266,000 | 17,529,000 | 18,338,000 | 17,889,000 | 20,109,000 | 21,701,000 |
Other Liabilities | 0 | 0 | 0 | 0 | 0 | 0 | 0 | 0 | 0 | 0 |
Capital Lease Obligations | 0 | 0 | 0 | 327,000 | 467,000 | 689,000 | 767,000 | 750,000 | 718,000 | 773,000 |
Total Liabilities | 15,523,000 | 15,052,000 | 15,539,000 | 15,787,000 | 16,374,000 | 20,673,000 | 21,891,000 | 21,971,000 | 24,503,000 | 25,927,000 |
Preferred Stock | 0 | 0 | 0 | 0 | 0 | 0 | 0 | 0 | 0 | 0 |
Common Stock | 6,000 | 6,000 | 6,000 | 6,000 | 6,000 | 6,000 | 6,000 | 6,000 | 6,000 | 6,000 |
Retained Earnings | 6,888,000 | 6,939,000 | 7,388,000 | 8,588,000 | 9,797,000 | 10,592,000 | 11,159,000 | 12,004,000 | 13,167,000 | 14,334,000 |
Accumulated Other Comprehensive Income Loss | 23,000 | -127,000 | -80,000 | 8,000 | -87,000 | -8,000 | 39,000 | 17,000 | -69,000 | -37,000 |
Other Total Stockholders Equity | -1,051,000 | -1,473,000 | -2,017,000 | -2,583,000 | -3,441,000 | -3,522,000 | -3,752,000 | -4,903,000 | -6,255,000 | -7,400,000 |
Total Stockholders Equity | 5,866,000 | 5,345,000 | 5,297,000 | 6,019,000 | 6,275,000 | 7,068,000 | 7,452,000 | 7,124,000 | 6,849,000 | 6,903,000 |
Total Equity | 5,889,000 | 5,367,000 | 5,320,000 | 6,042,000 | 6,276,000 | 7,070,000 | 7,454,000 | 7,126,000 | 6,864,000 | 6,896,000 |
Total Liabilities And Stockholders Equity | 21,412,000 | 20,419,000 | 20,859,000 | 21,829,000 | 22,650,000 | 27,743,000 | 29,345,000 | 29,097,000 | 31,367,000 | 32,823,000 |
Minority Interest | 23,000 | 22,000 | 23,000 | 23,000 | 1,000 | 2,000 | 2,000 | 2,000 | 15,000 | -7,000 |
Total Liabilities And Total Equity | 21,412,000 | 20,419,000 | 20,859,000 | 21,829,000 | 22,650,000 | 27,743,000 | 29,345,000 | 29,097,000 | 31,367,000 | 32,823,000 |
Total Investments | 408,000 | 360,000 | 320,000 | 269,000 | 406,000 | 483,000 | 426,000 | 432,000 | 578,000 | 606,000 |
Total Debt | 9,435,000 | 8,981,000 | 9,310,000 | 9,491,000 | 10,026,000 | 13,498,000 | 13,810,000 | 13,405,000 | 14,984,000 | 16,229,000 |
Net Debt | 8,128,000 | 8,942,000 | 9,278,000 | 9,469,000 | 9,965,000 | 9,937,000 | 13,257,000 | 13,287,000 | 14,633,000 | 15,771,000 |
Currency | USD | USD | USD | USD | USD | USD | USD | USD | USD | USD |
(* All numbers are in thousands)
Fiscal Year | 2014 | 2015 | 2016 | 2017 | 2018 | 2019 | 2020 | 2021 | 2022 | 2023 |
---|---|---|---|---|---|---|---|---|---|---|
Net Income | 1,338,000 | 752,000 | 1,180,000 | 1,949,000 | 1,923,000 | 1,671,000 | 1,496,000 | 1,817,000 | 2,240,000 | 2,276,000 |
Depreciation And Amortization | 1,292,000 | 1,245,000 | 1,301,000 | 1,376,000 | 1,477,000 | 1,574,000 | 1,671,000 | 1,999,000 | 1,284,000 | 1,326,000 |
Deferred Income Tax | -118,000 | 30,000 | 73,000 | -251,000 | 25,000 | 100,000 | 165,000 | -77,000 | 49,000 | 83,000 |
Stock Based Compensation | 65,000 | 72,000 | 90,000 | 101,000 | 89,000 | 86,000 | 94,000 | 108,000 | 84,000 | 93,000 |
Change In Working Capital | -265,000 | -378,000 | 77,000 | -201,000 | -29,000 | 80,000 | -327,000 | 126,000 | -145,000 | -251,000 |
Accounts Receivables | -268,000 | -178,000 | -78,000 | -271,000 | -16,000 | -53,000 | -179,000 | 28,000 | -329,000 | -161,000 |
Inventory | 3,000 | 9,000 | 352,000 | -16,000 | -30,000 | -243,000 | 216,000 | -234,000 | 0 | 59,000 |
Accounts Payables | 117,000 | -112,000 | -112,000 | 126,000 | 203,000 | 243,000 | -37,000 | 206,000 | 393,000 | 90,000 |
Other Working Capital | -117,000 | -97,000 | -85,000 | -40,000 | -186,000 | 133,000 | -327,000 | 126,000 | -209,000 | -239,000 |
Other Non Cash Items | 19,000 | 777,000 | 239,000 | 206,000 | 85,000 | 363,000 | 304,000 | 365,000 | 1,024,000 | 1,192,000 |
Net Cash Provided By Operating Activities | 2,331,000 | 2,498,000 | 2,960,000 | 3,180,000 | 3,570,000 | 3,874,000 | 3,403,000 | 4,338,000 | 4,536,000 | 4,719,000 |
Investments In Property Plant And Equipment | -1,151,000 | -1,233,000 | -1,339,000 | -1,509,000 | -1,694,000 | -1,818,000 | -1,632,000 | -1,904,000 | -2,587,000 | -2,895,000 |
Acquisitions Net | 2,185,000 | -429,000 | -589,000 | -101,000 | -252,000 | -472,000 | -3,200,000 | 21,000 | -350,000 | -92,000 |
Purchases Of Investments | 0 | -20,000 | -21,000 | 0 | 0 | 0 | 0 | 0 | 0 | 0 |
Sales Maturities Of Investments | 0 | 0 | 0 | 0 | 0 | 0 | 0 | 0 | 0 | 0 |
Other Investing Activites | -39,000 | 54,000 | -4,000 | 231,000 | -223,000 | -86,000 | -15,000 | -11,000 | -126,000 | -104,000 |
Net Cash Used For Investing Activites | 995,000 | -1,608,000 | -1,932,000 | -1,379,000 | -2,169,000 | -2,376,000 | -4,847,000 | -1,894,000 | -3,063,000 | -3,091,000 |
Debt Repayment | -3,568,000 | -2,764,000 | -2,682,000 | -1,907,000 | -499,000 | -1,534,000 | -7,807,000 | -8,404,000 | -7,328,000 | -20,394,000 |
Common Stock Issued | 2,910,000 | 2,414,000 | 3,120,000 | 1,635,000 | 864,000 | 4,750,000 | 7,661,000 | 8,014,000 | 44,000 | 21,350,000 |
Common Stock Repurchased | -600,000 | -600,000 | -725,000 | -750,000 | -1,004,000 | -248,000 | -402,000 | -1,350,000 | -1,500,000 | -1,302,000 |
Dividends Paid | -693,000 | -695,000 | -726,000 | -750,000 | -802,000 | -876,000 | -927,000 | -970,000 | -1,077,000 | -1,136,000 |
Other Financing Activites | -121,000 | -510,000 | -22,000 | -39,000 | -67,000 | -128,000 | -84,000 | -190,000 | 8,645,000 | -42,000 |
Net Cash Used Provided By Financing Activities | -2,072,000 | -2,155,000 | -1,035,000 | -1,811,000 | -1,508,000 | 1,964,000 | -1,559,000 | -2,900,000 | -1,216,000 | -1,524,000 |
Effect Of Forex Changes On Cash | -5,000 | -3,000 | -3,000 | 0 | -3,000 | 2,000 | 4,000 | 2,000 | -6,000 | 3,000 |
Net Change In Cash | 1,249,000 | -1,268,000 | -7,000 | -10,000 | -110,000 | 3,464,000 | -2,999,000 | -454,000 | 251,000 | 107,000 |
Cash At End Of Period | 1,307,000 | 39,000 | 32,000 | 22,000 | 183,000 | 3,647,000 | 648,000 | 194,000 | 445,000 | 552,000 |
Cash At Beginning Of Period | 58,000 | 1,307,000 | 39,000 | 32,000 | 293,000 | 183,000 | 3,647,000 | 648,000 | 194,000 | 445,000 |
Operating Cash Flow | 2,331,000 | 2,498,000 | 2,960,000 | 3,180,000 | 3,570,000 | 3,874,000 | 3,403,000 | 4,338,000 | 4,536,000 | 4,719,000 |
Capital Expenditure | -1,151,000 | -1,233,000 | -1,339,000 | -1,509,000 | -1,694,000 | -1,818,000 | -1,632,000 | -1,904,000 | -2,587,000 | -2,895,000 |
Free Cash Flow | 1,180,000 | 1,265,000 | 1,621,000 | 1,671,000 | 1,876,000 | 2,056,000 | 1,771,000 | 2,434,000 | 1,949,000 | 1,824,000 |
Currency | USD | USD | USD | USD | USD | USD | USD | USD | USD | USD |
(* All numbers are in thousands)
Revenue (TTM) : | 20.426B | P/S (TTM) : | 3.96 | |
Net Income (TTM) : | 2.304B | P/E (TTM) : | 32.06 | |
Enterprise Value (TTM) : | 100.731B | EV/FCF (TTM) : | 47.9 | |
Dividend Yield (TTM) : | 0.01 | Payout Ratio (TTM) : | 0.45 | |
ROE (TTM) : | 0.36 | ROIC (TTM) : | 0.1 | |
SG&A/Revenue (TTM) : | 0.09 | R&D/Revenue (TTM) : | 0 | |
Net Debt (TTM) : | 16.035B | Debt/Equity (TTM) | 2.09 | P/B (TTM) : | 10.61 | Current Ratio (TTM) : | 0.89 |
Trading Metrics:
Open: | Previous Close: | |||
Day Low: | Day High: | |||
Year Low: | Year High: | |||
Price Avg 50: | Price Avg 200: | |||
Volume: | Average Volume: | 1.606M |