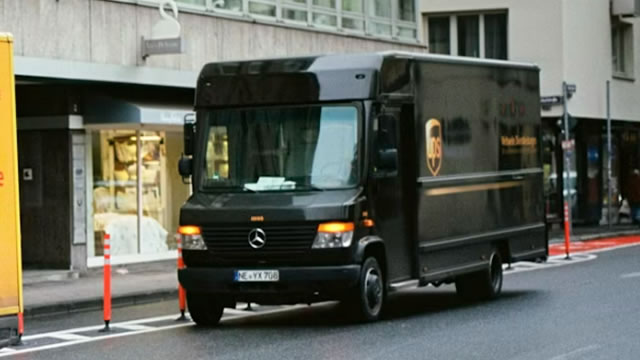
Exchange: | NYSE |
Market Cap: | 110.708B |
Shares Outstanding: | 853.37M |
Sector: | Industrials | |||||
Industry: | Integrated Freight & Logistics | |||||
CEO: | Ms. Carol B. Tome | |||||
Full Time Employees: | 500000 | |||||
Address: |
|
|||||
Website: | https://www.ups.com |
Click to read more…
Operator: Good Morning, my name is Greg Alexander, and I will be your facilitator today. I would like to welcome everyone to the UPS Third Quarter 2024 Earnings Conference Call. [Operator Instructions] It is now my pleasure to turn the floor over to your host, Mr. PJ Guido, Investor Relations Officer. Sir, the floor is yours.
PJ Guido: Good morning, and welcome to the UPS third quarter 2024 earnings call. Joining me today are Carol Tome, our CEO; Brian Dykes, our CFO and a few additional members of our executive leadership team. Before we begin, I want to remind you that some of the comments we'll make today are forward-looking statements within the Federal Securities Laws and address our expectations for the future performance or operating results of our company. These statements are subject to risks and uncertainties, which are described in our 2023 Form 10-K and other reports we file with or furnish to the Securities and Exchange Commission. These reports, when filed, are available on the UPS Investor Relations website and from the SEC. Unless stated otherwise, our discussion today refers to non-GAAP adjusted results. For the third quarter of 2024, GAAP results include an after-tax net gain of $36 million or $0.04 per diluted share, comprised of a $152 million gain from the divestiture of our Coyote Logistics business, net of transformation strategy costs of $116 million. Transformation strategy costs consisted of after-tax costs of $81 million related to our Fit to Serve program and $35 million related to our Transformation 2.0 program. Additional detail on our transformation costs and initiatives as well as a reconciliation of non-GAAP adjusted amounts to GAAP financial results is available in today's webcast materials. These materials will also be available on the UPS Investor Relations website. Following our prepared remarks, we will take questions from those joining us via the teleconference. [Operator Instructions] Please ask only one question so that we may allow as many as possible to participate. You may rejoin the queue for the opportunity to ask an additional question. And now, I'll turn the call over to Carol.
Carol Tome: Thank you, PJ, and good morning. On our last earnings call, we said that the second quarter would not only be the bottom, but a turning point for our performance and that we would return to revenue and profit growth in the third quarter, which we did. I would like to recognize and thank UPSers for their hard work and efforts. Their relentless focus on driving productivity while ensuring excellent customer service allowed us to deliver these results. In the third quarter, we faced a macro environment that was slightly worse than we expected. In the U.S., online sales slowed and manufacturing activity was lower than we anticipated. This slowdown in manufacturing activity was also true outside of the U.S. as we continue to see lower industrial production weigh on volume in certain geographies. But the macro-environment didn't prevent us from growing revenue and profit. As we leaned into the parts of the market that value our end-to-end network and we drove expense leverage through ongoing productivity initiatives. In the third quarter, our consolidated revenue was $22.2 billion, an increase of 5.6% versus last year. Consolidated operating profit was $2 billion, up 22.8% from last year and consolidated operating margin was 8.9%. In the U.S., this was the second consecutive quarter of average daily volume growth, and it was our highest year-over-year ADV growth rate since the first quarter of 2021. In International, average daily volume growth finished flattish and continued the upward momentum we've seen since the first quarter of this year. And in SCS, air and ocean forwarding contributed to strong revenue growth. Looking at the U.S., during the quarter, we focused on growing certain pockets of commercial business and grew B2B volume by nearly 1% compared to last year. One of the areas of commercial focus was retail B2B. Our B2B routes are in retail. In fact, we deliver merchandise to over 20,000 retail outlets across the country. To serve these customers, we offer a store replenishment with delivery window solution that provides retailers daily inventory replenishment within a two-hour window. Within this solution, we also provide visibility to the number of packages scheduled to be delivered. Our store replenishment solution, along with our RFID technology enables retailers to reduce stockouts and more efficiently run their receiving operations. This is just one example of how our customer-focused capabilities are enabling us to win new commercial volume. Now that U.S. volume is flowing back into our network, we have heightened our attention to revenue quality with a focus on the segments of the market we want to serve. You will recall that in the second quarter, we saw an unexpected surge of short zone lightweight e-commerce packages flow into our network. In the third quarter, we responded strategically, adjusting our pricing and optimizing our operating plans on a portion of this business. Further, we increased our focus on matching our pricing to the quality and attributes of the service we provide. We did this by leveraging the power of pricing science through our pricing architecture of tomorrow or AOT technology. Our revenue per piece growth rate improved in the third quarter from what we reported in the second quarter, and we expect this trend to continue. On the cost side, our team did an excellent job of managing expenses across the board. As it relates to our two major cost-out initiatives, we are continuing to deliver solid results. Fit to Serve, which was designed to optimize and rightsize our management structure, is slightly ahead of forecast. And with Network of the Future, so far this year, we've completed 45 operational closures, including nine full buildings that have been shut down. I'd like to give you a brief update on our customer-first, people-led innovation-driven strategy, starting with customer-first. As we discussed, we have a goal to become the number one complex healthcare logistics provider in the world. To that end, we said we would pursue certain inorganic opportunities and we have. Last month, we entered into an agreement to acquire Frigo-Trans, a move that will enhance our end-to-end temperature-sensitive healthcare capabilities across Europe. Today, 80% of pharmaceuticals in Europe require temperature-controlled transportation. Frigo-Trans offers pan-European cold-chain transportation as well as temperature-controlled and time-critical freight forwarding capabilities. Plus, Frigo-Trans has temperature-controlled warehousing capabilities with every temperature from cryopreservation, which is minus 196 degrees Celsius to ambience, which is about 25 degrees Celsius. We are targeting to close the Frigo-Trans acquisition in the first quarter of next year. Complex healthcare logistics is a growing business for us and we're continuing to invest in the capabilities needed to accelerate growth. We have dedicated healthcare facilities in 36 countries and provide specialized handling and visibility to our customers through our UPS premier product. In the third quarter, we generated $2.5 billion in consolidated healthcare revenue, which contributed to revenue growth across all three segments. Shifting to International. In time for the holidays, we've made several enhancements. In September, we expanded residential Saturday delivery to the eight largest markets in Europe without an additional charge. This enhancement meets our customers' need for speed, and we now provide a superior service offering. Further, we sped up deliveries to over 35 countries across Asia, Africa and the Middle East. And to meet the expected demand for this year's peak holiday season, we added over 200 flights connecting Asia to Europe and the U.S. Quickly touching on DAP, our Digital Access Program, DAP continues to deliver strong SMB growth in both B2B and B2C segments. In the first nine months of this year, we generated $2.3 billion in global GAAP revenue, and we expect to deliver over $3 billion in GAAP revenue for the full year. As you know, we have been onboarding our new air cargo business with the United States Postal Service. During the third quarter, our network planning teams worked closely with the USPS to ensure the transition progressed smoothly and it did. As of October 1, all contracted USPS air cargo business has been fully onboarded and we expect this business to deliver strong consistent revenue at an attractive margin. Moving to People-led. Since our founding, we've had a culture of driving safe work practices. And by using new technology and tools, we've seen a dramatic improvement in the number of injuries and accidents. For example, in the U.S., this year we've had our best auto safety results in 10 years. The advances in safety were achieved through innovative driver education and training, like our Integrad driver training schools. This focus on safety enables driver achievements like our Circle of Honor, which recognizes drivers with 25 years or more of driving without an accident. Today, our Circle of Honor has grown to nearly 10,000 drivers. Now let's turn to Innovation Driven, which for this call is all about the peak holiday season. This year's holiday season has only 17 shipping days between Black Friday and Christmas Eve. We haven't seen such a compressed peak since 2019. We do peak better than anyone and with six years in a row of industry leading service, we're confident our plans and execution will make that seven. To prepare, we've been collaborating with our customers on daily volume expectations and the timing of their promotions. While our customers are still expecting a good holiday selling season, recently, shippers have tempered their volume expectations. In any case, we'll be ready to deliver and we'll leverage our network planning tools and other proven technologies to control first how the volume comes in. Second, how to flow more volume to our automated facilities. And third, how to adjust the network to operate as efficiently as possible. And talking about efficiency. This year on our peak day, which is December 18th in the U.S. we expect to deliver 2 million more packages than we did on peak day last year, but we'll do it at a higher productivity rate. This will be possible due to the efficiency improvements we've made over the years and the use of seasonal support drivers, many of which are experienced part time UPSers who work inside our facilities. To sum it up, we're ready to deliver another successful peak. Moving to our financial outlook, we continue our better, not bigger approach, enhanced by some bold moves. The addition of the USPS air cargo business and the divestiture of Coyote are recent examples. With these moves, we eliminated a highly volatile truckload brokerage business and added air cargo volume that is predictable and margin positive. Looking at our consolidated revenue outlook in the third quarter, we increased our emphasis on revenue quality resulting in a glide down of certain volume which we expect will continue into the fourth quarter. Given our third quarter results, our latest peak volume expectations, and adjusting for the impact of the Coyote disposition, we now expect consolidated revenue of approximately $91.1 billion for the year and are lifting our consolidated operating margin target to approximately 9.6%. Brian will provide more details. So with that, thank you for listening. And now I'll turn the call over to Brian.
Brian Dykes: Thank you, Carol, and good morning, everyone. This morning, I will cover our third quarter results, review our capital allocation for the year, and then I'll wrap up by providing additional detail for our fourth quarter and full year financial outlook. Starting with our results, in the third quarter, we returned to revenue and profit growth the first time in two years. Looking at our consolidated performance, in the third quarter, we generated $22.2 billion in revenue, an increase of 5.6% compared to the third quarter of last year, with all three of our business segments delivering revenue growth. Consolidated operating profit was $2 billion, an increase of 22.8% versus the third quarter of 2023, and consolidated operating margin was 8.9%, an increase of 120 basis points compared to the third quarter of last year. Diluted earnings per share was $1.76, up 12.1% from the third quarter of 2023. Now let's look at our business segment. In the U.S. domestic segment, our performance in the third quarter was driven by two factors. First was strong volume growth, the highest growth rate we've seen in more than three years. And second was excellent cost management, which resulted in a year-over-year decrease in cost per piece of 4.1%. U.S. Average Daily Volume or ADV increased 6.5% compared to the third quarter of 2023. Looking at product mix in the third quarter, ground average daily volume increased 8.9%, while total air average daily volume was down 6.3%. We continue to see customers shifting down from air to ground and some ground volume is shifting down to SurePost. Within ground, SurePost volume levels rose slightly compared to the second quarter, driven by growth in our Digital Access program. While SurePost volume comes at a lower revenue per piece, given the enhancements we've made to our matching algorithm, we were able to redirect more SurePost packages into our network, driving delivery density. For the quarter, B2B average daily volume was up 0.8% year-over-year, increasing for the first time in two years. Growth was driven by SMBs, which had an increase in B2B average daily volume of 3.8%. B2C average daily volume increased 11% year-over-year and made up 58.3% of our volume, a slight downward shift from the second quarter. In terms of customer mix, we saw ADV growth from both enterprise and SMB customers. SMBs made up 29.4% of total U.S. volume in the third quarter. For the quarter, U.S. domestic generated revenue of $14.5 billion, up 5.8% compared to last year, driven by strong volume growth. As expected, U.S. domestic revenue per piece was down year-over-year. In the third quarter, revenue per piece declined 2.2% year-over-year, but showed a 40 basis point sequential improvement from the second quarter. Breaking down the components, first, we took actions to address revenue quality, which translated into higher base rates. In the quarter, base rates increased the revenue per piece growth rate by 170 basis points. Second, the combination of product mix, lighter weights and shorter zones decreased the revenue per piece growth rate by 300 basis points. And finally, we experienced a 90 basis point decline in the revenue per piece growth rate due to the combination of changes in customer mix and fuel. Turning to costs. As you all recall, the cost of our new labor contract was front end loaded. As of the end of July, we lapped the first year of the contract and for the quarter, Union wage rate growth slowed to 5.2% year-over-year. Productivity is a virtuous cycle at UPS and in the third quarter, we took several actions to drive productivity. Through our Network of the Future initiative, this year, we've completed 45 operational closures, contributing to an 8% improvement in pieces per workforce hour. While 8% might not seem like a big number, that translated into an efficiency gain of 11 million hours. Production improvements, including total service plan offset 50% of the Union wage increase and we continued to see positive trends in our safety performance, which contributed to lower expense. The U.S. domestic segment delivered $974 million in operating profit, a 46.5% increase compared to the third quarter of 2023, and the operating margin was 6.7%, a year-over-year increase of 180 basis points. Moving to our International segment. In the third quarter, our international business grew revenue and operating profit and expanded operating margin for the first time in nearly three years. This performance was driven by strength in exports in 13 of our top 20 export countries. Total international average daily volume growth continued its sequential improvement trend from the second quarter and was about flat to last year. In the third quarter, international revenue was $4.4 billion, up 3.4% from last year, with all regions growing revenue year-over-year. International revenue per piece increased 2.5%, driven by strong base pricing and the positive impact of region and product mix. Touching on costs, total international expense was relatively flat year-over-year, which was achieved by optimizing our network and our ongoing cost management efforts. Operating profit in the International segment was $792 million, an increase of 17.3% year-over-year. Operating margin in the third quarter was 18%, an increase of 220 basis points from a year ago. Moving to Supply Chain Solutions. In the third quarter, revenue was $3.4 billion, up 8% year-over-year. Looking at the key drivers, air and ocean forwarding revenue was up 15.1%, driven by strong market demand out of Asia. Logistics delivered revenue growth driven primarily by the impact of the MNX acquisition and onboarding of USPS air cargo contributed to revenue growth in SCS. Partially offsetting these gains was weaker performance at Coyote, our truckload brokerage business and the completion of the sale in mid-September. In the third quarter, Supply Chain Solutions generated operating profit of $217 million, down $58 million year-over-year, primarily driven by our efforts to configure our air network as we onboarded the USPS air cargo business. Now that we have fully onboarded this volume, we expect it to generate consistent revenue and we expect an attractive margin on a consolidated basis. For SCS, operating margin in the third quarter was 6.4%. Walking through the rest of the income statement, we had $230 million of interest expense, our other pension income was $68 million, and our effective tax rate for the third quarter was approximately 21%. Now let's turn to cash and capital allocation. So far this year, we've generated $6.8 billion in cash from operations and free cash flow of $4 billion, including our annual pension contribution of $1.4 billion. We refinanced $1.5 billion in current maturities year-to-date, and we finished the quarter with strong liquidity and no outstanding commercial paper. So far this year, UPS has paid $4 billion in dividends. And lastly, we've completed our targeted $500 million share repurchase program in the third quarter, which brings us to our outlook. In July, we provided an update to our full year financial targets based on global economic forecast and our performance in the first half of the year. Now looking ahead at the full year, we have updated our outlook to reflect three things. First, our third-quarter results and the focus on revenue quality; second, the sale of Coyote; and finally, new softer peak volume forecast from our customers. At the consolidated level, we now expect full year revenue of approximately $91.1 billion. Due to our focus on revenue quality, coupled with the efficiency of our integrated network and our ability to manage costs, we are lifting our consolidated operating margin expectation to approximately 9.6% to align with these new volume and revenue expectations. Now looking at the segments in the fourth quarter. Starting with U.S. domestic, we expect the combination of both volume and revenue per piece growth to increase revenue by 1.5% in the fourth quarter. We expect to generate a fourth quarter operating margin of approximately 9.5%, and we now expect the operating margin in December to be slightly higher than 10%. Looking at International. We expect the positive volume momentum we've experienced throughout the year will continue. With that in mind, we expect fourth-quarter revenue growth to be up mid-single digits year-over-year and we still expect around a 20% operating margin in the fourth quarter. In Supply Chain Solutions, we expect revenue in the fourth quarter of around $3.3 billion, which takes into consideration the disposition of Coyote, and we expect to generate an operating margin of approximately 9%. Turning to capital allocation. For the full year in 2024, we expect free cash flow to be around $5.1 billion after the $1.4 billion pension contribution we made to fund annual service costs. Capital expenditures are expected to be about $4 billion. We plan to pay around $5.4 billion in dividends subject to Board approval. And lastly, we expect the tax rate for the full year to be between 23% and 23.5%. With that, operator, please open the lines for questions.
Operator: Thank you. We will now conduct a question-and-answer session. Our first question comes from the line of David Vernon from Bernstein. Please go ahead.
David Vernon: Hi, good morning, everyone, and thanks for taking the time and taking the questions. So when we think about the ramp here from 3Q into 4Q, the operating profit guidance sort of suggests a close to a 50% bump from 3Q to 4Q. Can -- Brian, maybe can you walk us through some of the drivers of what makes that look realistic? And then if you think about that -- those drivers taking hold, how does that affect sort of the shape of profitability as we carry into 2025?
Brian Dykes: Sure. Thank you, David, and I appreciate the question. And yes, we do have an increase from Q3 to Q4 on the profit side. And really it's driven by a couple of things. One, as we mentioned, this focus on revenue quality and the moves that we've made to drive revenue improvement, both through pricing policy as well as the take rate that we're seeing on HCS coupled with the acceleration of Fit to Serve and Network of the Future and just the productivity initiatives give us the incremental bump over the normal seasonality. We feel very confident in both of those and we're seeing them actually start to come through in the third quarter and early in the fourth quarter on the revenue side. And you can see from our cost performance, we feel that the Fit to Serve and NOS stuff is sticking very well.
David Vernon: And then how that's going to affect sort of into 2025?
Brian Dykes: Yes. And so as we roll through '24, you can see that we've raised the consolidated margin. We do expect the domestic margin to be around 9.5%. And now we do expect to exit the year higher than -- slightly higher than the 10% that we guided to before. We'll come back to you as we get through peak on '25, but we want to close out peak first.
David Vernon: All right. Thank you.
Brian Dykes: Thank you.
Operator: Your next question comes from the line of Brian Ossenbeck from JPMorgan. Please go ahead.
Brian Ossenbeck: Hi, good morning. Thanks for taking the questions. Maybe can you expand a little bit more on the softness you're seeing into peak season? What type of themes and concerns maybe you're hearing from the customers as they sort of dialed down their expectations on volume? And maybe within that a broader comment on the pricing and the surcharges ticking if you're getting more pushback on that or seeing more trade-downs at this point? Thank you.
Carol Tome: Well, I'll start with the customer feedback. We work with a little over 100 of our customers who represent 60% of the volume in our network, but 85% of the peak surge. So we develop operating plans for each of these customers. And these plans have been in process now for months. As the year has progressed, they continue to tighten up their forecast and we just received their last forecast on October 2. And their forecast have been tempered and we believe it's driven by a couple of factors. First, external forecast for the holiday season have come in. In fact, the forecast for ESMO in the fourth quarter is now about 3%. Earlier in the year, it had been about 5%. If you look at just the peak part of the holiday season, forecasts are all over the board, candidly from a low of 2% to a high of 11% and SMB Global has it at about 3.5%. Part of this, we believe, is influenced by the tight compressed peak period. There are only 17 shipping days between Thanksgiving and Christmas Eve. And what forecasters and some of our customers are saying is because of the tightness of the shipping season that many customers will go into a store to complete their holiday purchases. The consumer actually is in pretty good shape, but we think there'll be some dynamics in how the consumer shops during the peak season. So it will still be a good peak. In fact, in our prepared remarks, we called out that on peak day, we'll deliver 2 million more packages than we did last year. It will still be a good peak, but just not as dynamic as people thought at the beginning of the year. Whatever happens, we're prepared. We're prepared to handle the volume. And then on the pricing surcharge, we're seeing a really good take rate on the pricing surcharge for the holiday, I should say. And maybe Matt Guffey is here. Matt, perhaps you want to comment on the holiday surcharge?
Matt Guffey: Yes, absolutely. So first off, we're working closely in collaboration with all of our customers. Carol talked about the top 100, which are extremely important just due to the peakiness that they bring during the season. But we've really worked again. We've got a good structure and a process in place where we can manage our holiday demand surcharge at the customer level and we have a lot more flexibility to work with them as we go through the peak season. Look, at the end of it, it's all about us creating -- continuing to drive value and -- with our customers and to deliver a great peak. So we're staying close on the forecast, but also working very closely with them on this holiday demand surcharge.
Carol Tome: And we're seeing a good keep rate on…
Matt Guffey: Very -- yes, very, very good keep rate, probably one of the best keep rates we've seen, so.
Brian Dykes: And Brian, I would just add that we're on our plan, if you remember, there were changes because of the compressed peak that opened the peak -- the holiday demand surcharge to a larger set of volume, right, and that's what drives some of the incremental outperformance year-over-year that you're seeing.
Carol Tome: Yes.
Brian Ossenbeck: Okay. Thank you very much.
Operator: Your next question comes from the line of Chris Wetherbee from Wells Fargo. Please go ahead.
Chris Wetherbee: Hi, thanks. Good morning. I wanted to drill down a little bit on the cost improvement on a per piece basis in domestic, so down about 4%. It was better than what we were looking for. I guess maybe two pieces to the question. How do you think about that progress potential in the fourth quarter? And then maybe widening out a little bit with some of the initiatives that you're working on bigger picture about managing the footprint as well as maybe the headcount, how do we think this can trend as we move into 2025?
Carol Tome: So why don't you take the fourth quarter question and then we'll turn to Nando for some thoughts.
Brian Dykes: Great. Yes, thank you. And yes, it's a great question because the cost performance in the third quarter was outstanding, right? And I think there's a couple of dynamics that are going on. As we said in our earlier remarks, we lapped the contract at the end of July, right? So you start to see that high wage inflation that we talked about in the second quarter as being 12%, now coming down to 5.2% and we will now get a full clean quarter of wage inflation at a normalized level in Q4. But also, as we mentioned, we've accelerated Fit to Serve and are now outperforming our forecast as well, as you'll see from the Network of the Future discussion that -- we've closed more sorts and we've closed more buildings. So we're pulling that forward, which helps in the cost performance. As we carry into Q4, we do expect to have strong cost performance. We'll probably be up about 1% per piece, which is still going to be less than our rev per piece growth rate. So we'll maintain a positive spread, but it'll be a little bit more normal as you go through it. Nando, you want to talk a little bit about network in future now we're pulling things forward?
Nando Cesarone: Yes. Thanks, Brian. And look, you may be asking how are we able to have 45 operational closures and nine buildings that we've closed. We are moving much more volume about 5% through our automated facilities and we're also making sure that our legacy of production indices are performing the way we expect them to perform. The teams are doing an excellent job allowing us to really shrink the network and be a lot more productive. Safety of course helped. And at the end of the day, it comes down to hours and people, and we were down about 11 million hours compared to the last year. So really just an excellent job all around. And the last thing I would say is there's nothing that we're overlooking so every piece of our business, from car wash to automated dispatching, we are prepared for all of it and looking and scrutinizing all of that cost and finding some good improvements there.
Carol Tome: All the while maintaining outstanding service levels, which is job number one for UPS. And just to put the 5% number that Nando mentioned into perspective, he's talking about automated volume through our hubs, right. And we now processed 63% of the volume in our hubs in some sort of an automated way. That's up 5 percentage points from a year ago. That's pretty good.
Brian Dykes: Absolutely. And look, we've got 21 active projects here in this quarter. You would think it's peak season. Why would we take that undertaking? We have full confidence that that's going to provide very good productivity improvements. And then next year, we're accelerating and pulling in the number of projects that we can execute in 2025.
Operator: Your next question comes from the line of Tom Wadewitz from UBS. Please go-ahead.
Tom Wadewitz: Yes, good morning and congratulations on the strong results. I wanted to ask a bit about, Carol, you started the call. I think you commented about some industrial economy weakness. You're clearly doing some idiosyncratic -- excuse me, idiosyncratic things that are going well. How do you think about as we go into 2025, how much of margin improvement would be in your control? And if you don't see improvement in macro, is it reasonable to translate improvement in revenue per piece and network of the future, those things to margin expansion? Thank you.
Carol Tome: Well, I think our team has done a masterful job of managing a very choppy environment over the past several years, actually. And as we think about our business outside the United States, we saw improvement in every quarter this year. In fact, our export business grew in the third quarter and domestic was down just slightly. So, Kate, maybe you want to talk about how you would manage the business outside the United States if the industrial production remains softish?
Kate Gutmann: Yes, absolutely. And I think the quarter was a good example of that. The macro indicators have come down, but yet we've expanded the revenue, profit and margin in the international business and posting an 8% margin. We intend to continue to run those same plays. Let me go into a few. Just as Nando indicated, on the domestic side, 60% of our volume goes through automated hubs and that's for the domestic and transporter of all of our large international volume markets. And then on the air side of the house, we continue to show that revenue quality matters, especially when you have expensive assets and we align with demand. So we had strong rev per piece for international we held our cost CPP flat and so delivered operating leverage. We would continue to do that into the next year.
Carol Tome: And in-markets that are soft to win, you gain share. And you gain share not by dropping price, but by actually increasing your capability. And our Saturday delivery is one example of that. We are the only carrier that offers standard Saturday delivery at no charge in these eight markets. And that's driving some nice performance, isn't it, Kate? We just started it.
Kate Gutmann: It really is. And so Europe and Canada exceeding expectations, unlocking more of the customer share of wallet and in the premium spaces too. So cross border trade we're seeing growth with the expansion of our service out of Asia to Europe as well as throughout intra-Asia we've made the lanes faster and as a result that premium unlock and by the way with rev per piece growing. So we feel good about the equations and we'll definitely continue it.
Tom Wadewitz: Do you -- I don't think I asked the question well. I actually was thinking a little bit about domestic in terms of the margin.
Carol Tome: So I think in the domestic side, productivity is a virtuous cycle here. And as Nando pointed out, there's nothing that's not under review, right. Everything is under review and we continue to drive productivity that exceeds our expectations. Brian, anything you want to add?
Brian Dykes: Yes, I would just say so. So if you remember, look, we've got a contract that locked up that we have known costs for the next four years for 60% of our domestic cost structure. With the focus on revenue quality and our ability to win more and win new in the places where we really want to, like you saw in the third quarter with commercial and SMB commercial growing -- starting to grow again, we do think we have the ability to: One, continue to take action to drive rev per piece ourselves as well as Carol said, productivity -- production is a virtuous cycle with a known cost structure as we go into '25.
Carol Tome: And we like that commercial business. We -- it's got a more dense delivery metric associated with that, in other words, more packages per delivery. And one way we can win commercial is with new capabilities. So we had a big win in the third quarter and the determining factor for this customer to come into our network were our RFID labels. So that's a new capability that we didn't have before.
Tom Wadewitz: Great. Thank you.
Carol Tome: Thank you.
Operator: Your next question comes from the line of Conor Cunningham from Melius Research. Please go ahead. Conor Cunningham, your line is open. Check your mute button. Okay, we'll move on. We'll go to the line of Jordan Alliger from Goldman Sachs. Please go ahead.
Jordan Alliger: Yes, hi. Morning. Question for you. So a little bit more on the U.S. Postal onboarding. If I could maybe if you could share some of the experience. I know you had the upfront step up costs, but as it's still, a few weeks in, perhaps talk about how the operations are going there. Is it delivering on the profit levels that you had talked about and just any general thoughts around how that's going to contribute going forward? Thanks.
Carol Tome: Well, as you point out, Jordan, we did have a bit of a transition in the third quarter. The USPS contract with their previous carrier expired October 1st. And we didn't want to wait until October 1st to onboard that volume because peak is right around the corner. So we agreed with the USPS that we would operationalize this service to them, while over-time, they onboarded their volume. And it was over-time, actually, we didn't get much weight until September. So there was a mismatch between our operational model and the volume. But now the volume is all in. So the fourth quarter is going to look a lot different than the third quarter did. And from a performance perspective, Nando, you just met with the Postmaster General. And so tell us what he said.
Nando Cesarone: Sure. So as early as yesterday, we meet face-to-face and yesterday the purpose was peak planning. So both teams face-to-face in DC and we're working really well. Professionals on both sides that have executed a very difficult plan and made it look very, very simple. Feedback from the Postmaster General himself has been positive and we see the resources that we've applied are in-line with what we had modeled when we have accepted the business and the contract was negotiated with the USPS. So good things ahead for that contract.
Carol Tome: And I just can't overemphasize the heavy lift here. In fact, it was over 50 million cubic feet that we had to take into our network in the third quarter and there'll be more obviously in the fourth. So job well done by our team in working with the USPS as well.
Nando Cesarone: Absolutely.
Jordan Alliger: Thank you.
Operator: Your next question comes from the line of Bascome Majors from Susquehanna. Please go ahead.
Bascome Majors: Thanks for taking my questions. Just to follow up on another piece of the postal service relationship. Can you talk about where you are in negotiating the delivery service agreement that enables SurePost in Sunday delivery with their effort to renegotiate some of those contracts? And maybe along with that, what challenges does that create either on cost-to-serve or Sunday delivery operations, but also what opportunities might that create for your own trucks to deliver more packages in the marketplace in a world where the post office is seeking to retain more upstream business and push customers into that? Thank you.
Carol Tome: Well, thanks for the question. And Matt, why don't you take on this question?
Matt Guffey: Yes. So first-off, so we -- to Nando's point, we had an opportunity to meet with the PMG yesterday. We continually work to find a mutually agreeable agreement for both USPS and UPS. More work to be done, but we are moving very, very quickly and hopefully, we'll have this to a close in very short order.
Carol Tome: And to your question about what challenges and what opportunities, I think it's some and some. I think it's some and some. And so once we get this contract agreed to, we'll show you what those sum and some are, but we're confident we can work through this.
Bascome Majors: In the expiration, I believe you've said before, it's at year-end. Can you confirm roughly when we should hear more on that and what the go forward relationship will be?
Carol Tome: Yes, you should hear something about it in our fourth quarter earnings.
Brian Dykes: Yes. No impact in the fourth quarter. We'll tell you more about it when we come back with the fourth quarter earnings in January.
Bascome Majors: Thank you.
Operator: Your next question comes from the line of Ari Rosa from Citigroup. Please go ahead.
Ari Rosa: Hi, good morning. I was hoping if you could give us a sense of how much excess capacity you see in the network right now. Just trying to understand how you're thinking about planning kind of given the weaker outlook in terms of both customer demand and also industrial production and some of the weakness in the macro. How do you think about kind of matching resources to that lower volume? And do you think you're carrying excess resources right now?
Carol Tome: So I think our team has done an excellent job of taking capacity out of the market. In fact, with 45 million -- 45 operational closures, it's about 1 million ADV per day of capacity that we've taken out of the market and we see capacity rationalization happening in other parts of the market as well. Clearly, it's peak time. So we're all adding resources to handle the surge in the holiday, but capacity is coming in.
Operator: Your next question comes from the line of Scott Group from Wolfe Research. Please go ahead.
Scott Group: Hi, thanks, good morning. So how much, if any, does the new USPS contract help the fourth quarter U.S. margin just with the cost allocation? And then I don't -- Carol, I just -- big-picture, right, you're now saying margins in the U.S. in Q4 are going to be -- they'll be slightly positive. We've now lapped the Teamster contract, yields are now turning positive. That's good. Peak season surcharges. Just big picture, like when do we start to see more meaningful margin improvement? Does that start right away in '25? Or does that take some more time?
Carol Tome: First, why don't we address the path to the fourth quarter?
Brian Dykes: Sure, sure. So, hi, Scott, and thank you for the question. So on the USPS contract, so we put a network in place that was all part of the plan. There's no incremental impact to domestic in the fourth quarter from the USPS contract. The cost that we -- the cost that Carol referred to was start-up costs associated with getting the contract stood up that was -- that impacted SCS, doesn't impact domestic. And in the fourth quarter, we'll see SCS go back to 9 -- about 9% and domestic to around 9.5%. So I don't think that's going to impact us there.
Carol Tome: No. And then in terms of when are we going to see more meaningful margin expansion, let us get through the fourth quarter and then we'll give you our outlook for 2025.
Scott Group: Thank you.
Operator: Your next question comes from the line of Stephanie Moore from Jefferies. Please go ahead.
Stephanie Moore: Great. Thank you. Good morning. I was hoping you could talk a little bit about our domestic RPP trends throughout the quarter. Maybe if you could talk a little bit about how they trended as the months progressed and really what this means for 4Q and your thoughts into 2025 if you have them? Thanks.
Brian Dykes: Sure. Thanks for the question, Stephanie. Yes, so we saw positive momentum going from Q2 to Q3 in domestic rev per piece. As I mentioned in my earlier remarks, really when you think about what happened in the base rate, in the second quarter, base rate added about 90 basis points of improvement to rev per piece. In the third quarter, that jumped to 170 basis points. Now as we translate into the fourth quarter, we actually expect rev per piece to inflect positive in the U.S. and that's really driven by a couple of things. Look, we talked about actions that we were going to take around specific customers that were enabled by our architecture of tomorrow and the work that we've been doing and investments have been made to create more sensitive demand channels, DAP and AOT and the modifiers. And we're leveraging those in order to make adjustments to help drive rev per piece. The other thing is what we're doing on the surcharging and the GRIs that we will continue to see lift as we go through the fourth quarter and into '25. So look, it's a positive trajectory on rev per piece and it's clearly an area of focus as we move from our year-one to our plus two strategy.
Carol Tome: And pricing architecture of tomorrow is really moving from the art to the science of pricing. And one of the elements of this architecture are modifiers that we use, modifiers that can provide discounts to our customers or modifiers that allow us to increase the price. And I'll just give you a real life example of what happened in the third quarter to help you understand. In the third quarter, we had a discount modifier that we adjusted, basically test the elasticity. We reduced the discount by 25%, which increased the RPP by 12% and reduced the volume by 26%. We liked that trade. And because it's a modifier, it's not a contract that has to be reopened and renegotiated. You just adjust the model. And this is just one element of pricing architecture of tomorrow that we will use not only in the fourth quarter, but in '25 and beyond.
Stephanie Moore: Great. Thank you.
Operator: Your next question comes from the line of Daniel Imbro from Stephens. Please go ahead.
Joe Enderlin: Hi guys, this is Joe Enderlin on for Daniel. Thanks for taking the question. Just wanted to ask another one actually on revenue per piece. One of your peers noted increased price competition in the market. Just are you seeing any of that today? And then do you think we've felt peak trade-down pressures yet?
Brian Dykes: So I'll start on the price pressures. Look, we -- just in a very price-competitive industry, but we think it's very rational, right? And when you look bid-for-bid and product-to-product, it is very rational. We know we have to win on capabilities and that's where we continue to add. With every customer every day, it's -- you got to deliver service to do it. It starts with us with service and then we add incremental capabilities like RFID to win where we really want to win most. And I point that as Carol mentioned, we've had big enterprise commercial wins through that. We also have seen commercial now grow nearly 1% for the first time this year as we really started to catch that from the contract, that's been a big momentum point. And then specifically, SMB commercial growing 3.8%. Those sorts of things allow -- the capabilities that we have, allow us to win more and win new in those areas that help drive rev per piece growth despite a very competitive rate environment.
Operator: Your next question comes from the line of Brandon Oglenski from Barclays. Please go ahead.
Brandon Oglenski: Hi, good morning and thanks for taking the question and congrats on growth for the first time in a couple of years here. Good to see. Carol, I think you mentioned something about enterprise customers. And I know in the past, you've talked about glide down. So can you just put that in context as you head into 2025? And then just very quickly on Fit to Serve, I didn't get it, but is that going to incrementally deliver more in the fourth quarter? Thank you.
Carol Tome: So first on the customer glide down, we have, as you know, been in a glide-down arrangement with our largest customer and they continue to be our largest customer. I think it's fair to say that we have seen them drive a lot of the reduction in our air volume. In fact, if I look at the third quarter performance, 100% of the decline in air volume was down about 6.5% that is attributable to the largest customer. So they, like many, trading down from air to ground and in their case, a little bit of ground out to their own network. But we're fine with that because it creates opportunity for us to grow in other areas. And then looking ahead...
Brian Dykes: And then on the Fit to Serve point, yes, so we do expect about $70 million incremental to go about $350 million in the fourth quarter, and we've seen great progress with that program.
Brandon Oglenski: Thank you.
Operator: Your next question comes from the line of Ken Hoexter from Bank of America. Please go ahead.
Adam Rakowski: Hi, good morning. This is Adam Rakowski on for Ken Hoexter. You noted in the release that you are a - scope of the Fit to Serve initiative, which previously called for a reduction of about 12,000 positions. Could you just expand on what that means? Is there -- has that actually accelerated this quarter? And just any thoughts on how you would expand the scope and what you would target there? Thanks.
Carol Tome: So you're just asking for a status update on Fit to Serve?
Brian Dykes: Sure. Yes. On Fit to Serve, as we said, we have pulled forward incremental savings opportunities. We are -- we hit the full run rate that we expected. We will have some incremental benefit as we wrap into the fourth quarter, but we're continuing forward with it as planned.
Carol Tome: And to your question, do you have additional opportunities. We are an opportunity rich company. And as you heard from Nando, we're looking at all opportunities to drive a better experience for our customer and actually higher productivity,
Brian Dykes: Greg, we have time for one more question.
Operator: Okay. Your final question comes from the line of Ravi Shankar from Morgan Stanley. Please go ahead.
Ravi Shankar: Thanks. Good morning, everyone. So maybe just to follow-up on the holiday side, I think you announced a pretty big step up in your hiring for the first time in many years. I know it's a peak compressed -- compressed earnings peak season. But what's the logic behind that, if you're seeing a little bit of a reduction in customer experience or expectations on volumes here, how do we think of squaring that? And is there like a minimum surcharge bogey you guys need to kind of COVID the extra costs? Thank you.
Carol Tome: So last year we announced that we were hiring 100,000 for the peak holiday season and our ADV declined 7.4%. This year we announced that we're hiring 125,000 and our ADV will be positive. So it's not out of the realm of reason that we should hire more people this year than we did last year. But this is what you need to know. We will hire what we need for peak regardless of where the volume actually ends up. We're not going to over hire for peak. We will hire what we need. And what we've done over time, Ravi, is we've added this amazing capability where within just a few -- less than an hour, just a few minutes, we can actually get a job offer out or we can rescind a job offer so we can flex up or flex down the way we need to. And Nando, would you like to add anything?
Nando Cesarone: Yes. I would just say the number also includes a favorable employee mix. So this year, we're adding -- we're going to increase our helper teams with our drivers by about 10%. That's not a small number. So a big percentage of our volume will be delivered by helpers, seasonal helpers that can deliver at Christmas time and we've amped that up and make sure that we've got every position optimized and that is the number, as Carol had said, and we're going to deliver a great peak season.
Ravi Shankar: Thank you.
PJ Guido: Thank you, Greg. This concludes our call. Thank you all for joining and have a great day.
Operator: Ladies and gentlemen, that does conclude your conference for today. Thank you for your participation and for using AT&T Teleconference. You may now disconnect.
Subscribe now to gain full access to the earnings summary, 5 years analyst estimates and more exclusive content.
Subscribe NowWARNING: AI-generated summary.
While this is a phenomenal tool that can save you time and provide meaningful insights and key takeaways from the earnings call, it may contain inaccuracies or misinterpretations. For precise information, please refer to the original transcript.
(* All numbers are in thousands)
Fiscal Year | 2014 | 2015 | 2016 | 2017 | 2018 | 2019 | 2020 | 2021 | 2022 | 2023 |
---|---|---|---|---|---|---|---|---|---|---|
Revenue | 58,232,000 | 58,363,000 | 60,906,000 | 65,872,000 | 71,861,000 | 74,094,000 | 84,628,000 | 97,287,000 | 100,338,000 | 90,958,000 |
Cost Of Revenue | 32,045,000 | 31,028,000 | 55,439,000 | 58,343,000 | 64,837,000 | 66,296,000 | 76,814,000 | 84,477,000 | 87,244,000 | 73,727,000 |
Gross Profit | 26,187,000 | 27,335,000 | 5,467,000 | 7,529,000 | 7,024,000 | 7,798,000 | 7,814,000 | 12,810,000 | 13,094,000 | 17,231,000 |
Research And Development Expenses | 0 | 0 | 0 | 0 | 0 | 0 | 0 | 0 | 0 | 0 |
General And Administrative Expenses | 0 | 0 | 0 | 0 | 0 | 0 | 0 | 46,707,000 | 0 | 0 |
Selling And Marketing Expenses | 0 | 0 | 0 | 0 | 0 | 0 | 0 | 0 | 0 | 0 |
Selling General And Administrative Expenses | 0 | 0 | 7,266,000 | 5,855,000 | 7,092,000 | 8,217,000 | 13,947,000 | 46,707,000 | 7,112,000 | 8,090,000 |
Other Expenses | 4,538,000 | 4,636,000 | 4,623,000 | 5,039,000 | -490,000 | 5,919,000 | 7,470,000 | 4,457,000 | 87,244,000 | 81,817,000 |
Operating Expenses | 21,219,000 | 19,667,000 | 4,623,000 | 5,039,000 | 5,465,000 | 5,919,000 | 7,470,000 | 46,707,000 | 87,244,000 | 8,090,000 |
Cost And Expenses | 53,264,000 | 50,695,000 | 55,439,000 | 58,343,000 | 64,837,000 | 66,296,000 | 76,814,000 | 84,477,000 | 174,488,000 | 81,817,000 |
Interest Income | 0 | 0 | 0 | 0 | 0 | 468,000 | 857,000 | 692,000 | 696,000 | 312,000 |
Interest Expense | 353,000 | 341,000 | 381,000 | 453,000 | 605,000 | 653,000 | 701,000 | 694,000 | 704,000 | 785,000 |
Depreciation And Amortization | 1,923,000 | 2,084,000 | 2,224,000 | 2,282,000 | 2,207,000 | 2,360,000 | 2,698,000 | 2,953,000 | 3,188,000 | 3,366,000 |
EBITDA | 4,968,000 | 7,668,000 | 5,467,000 | 7,529,000 | 6,534,000 | 6,176,000 | 5,336,000 | 20,220,000 | 18,533,000 | 12,507,000 |
Operating Income | 4,968,000 | 7,668,000 | 5,467,000 | 7,529,000 | 7,024,000 | 3,816,000 | 2,638,000 | 17,267,000 | 13,094,000 | 9,141,000 |
Total Other Income Expenses Net | 22,000 | 15,000 | 50,000 | 72,000 | -400,000 | 1,836,000 | -664,000 | -672,000 | 1,731,000 | -568,000 |
income Before Tax | 4,637,000 | 7,342,000 | 5,136,000 | 7,148,000 | 6,019,000 | 5,652,000 | 1,974,000 | 16,595,000 | 14,825,000 | 8,573,000 |
Income Tax Expense | 1,605,000 | 2,498,000 | 1,705,000 | 2,238,000 | 1,228,000 | 1,212,000 | 547,000 | 3,705,000 | 3,277,000 | 1,865,000 |
Net Income | 3,032,000 | 4,844,000 | 3,431,000 | 4,910,000 | 4,791,000 | 4,440,000 | 1,343,000 | 12,890,000 | 11,548,000 | 6,708,000 |
Eps | 3.310 | 5.380 | 3.890 | 5.640 | 5.530 | 5.140 | 1.650 | 14.750 | 13.260 | 7.810 |
Eps Diluted | 3.280 | 5.350 | 3.870 | 5.610 | 5.510 | 5.110 | 1.640 | 14.680 | 13.200 | 7.800 |
Weighted Average Shares Outstanding | 916,000 | 901,000 | 883,000 | 871,000 | 866,000 | 864,000 | 867,000 | 874,000 | 871,000 | 859,000 |
Weighted Average Shares Outstanding Diluted | 924,000 | 906,000 | 887,000 | 875,000 | 870,000 | 869,000 | 871,000 | 878,000 | 871,000 | 860,000 |
Currency | USD | USD | USD | USD | USD | USD | USD | USD | USD | USD |
(* All numbers are in thousands)
Fiscal Year | 2014 | 2015 | 2016 | 2017 | 2018 | 2019 | 2020 | 2021 | 2022 | 2023 |
---|---|---|---|---|---|---|---|---|---|---|
Cash And Cash Equivalents | 2,291,000 | 2,730,000 | 3,476,000 | 3,320,000 | 4,225,000 | 5,238,000 | 5,910,000 | 10,255,000 | 5,602,000 | 3,206,000 |
Short Term Investments | 992,000 | 1,996,000 | 1,091,000 | 749,000 | 810,000 | 503,000 | 406,000 | 338,000 | 1,993,000 | 2,866,000 |
Cash And Short Term Investments | 3,283,000 | 4,726,000 | 4,567,000 | 4,069,000 | 5,035,000 | 5,741,000 | 6,316,000 | 10,593,000 | 7,595,000 | 6,072,000 |
Net Receivables | 6,661,000 | 7,134,000 | 7,695,000 | 10,346,000 | 9,898,000 | 9,934,000 | 10,750,000 | 12,541,000 | 12,583,000 | 11,216,000 |
Inventory | 344,000 | 308,000 | 342,000 | 404,000 | 421,000 | 511,000 | 620,000 | 717,000 | 889,000 | 935,000 |
Other Current Assets | 930,000 | 1,040,000 | 8,821,000 | 11,479,000 | 10,696,000 | 11,362,000 | 1,953,000 | 1,800,000 | 2,039,000 | 2,125,000 |
Total Current Assets | 11,808,000 | 13,208,000 | 13,388,000 | 15,548,000 | 15,731,000 | 17,103,000 | 20,300,000 | 24,934,000 | 22,217,000 | 19,413,000 |
Property Plant Equipment Net | 18,281,000 | 18,352,000 | 18,800,000 | 22,118,000 | 26,576,000 | 30,482,000 | 35,327,000 | 37,037,000 | 38,474,000 | 41,253,000 |
Goodwill | 2,184,000 | 3,419,000 | 3,757,000 | 3,872,000 | 3,811,000 | 3,813,000 | 3,367,000 | 3,692,000 | 4,223,000 | 4,872,000 |
Intangible Assets | 847,000 | 1,549,000 | 1,758,000 | 1,964,000 | 2,076,000 | 2,167,000 | 2,274,000 | 2,486,000 | 2,796,000 | 3,305,000 |
Goodwill And Intangible Assets | 3,031,000 | 4,968,000 | 5,515,000 | 5,836,000 | 5,887,000 | 5,980,000 | 5,641,000 | 6,178,000 | 7,019,000 | 8,177,000 |
Long Term Investments | 489,000 | 473,000 | 476,000 | 483,000 | 170,000 | 21,000 | 25,000 | 26,000 | 20,000 | 424,000 |
Tax Assets | 652,000 | 255,000 | 591,000 | 265,000 | 141,000 | 330,000 | 527,000 | 176,000 | 139,000 | 126,000 |
Other Non Current Assets | 1,210,000 | 1,055,000 | 1,631,000 | 1,153,000 | 1,084,000 | 3,941,000 | 672,000 | 1,054,000 | 3,255,000 | 1,464,000 |
Total Non Current Assets | 23,663,000 | 25,103,000 | 27,013,000 | 29,855,000 | 33,858,000 | 40,754,000 | 42,192,000 | 44,471,000 | 48,907,000 | 51,444,000 |
Other Assets | 0 | 0 | 0 | 0 | 0 | 0 | 0 | 0 | 0 | 0 |
Total Assets | 35,471,000 | 38,311,000 | 40,401,000 | 45,403,000 | 49,589,000 | 57,857,000 | 62,492,000 | 69,405,000 | 71,124,000 | 70,857,000 |
Account Payables | 2,754,000 | 2,587,000 | 3,042,000 | 3,872,000 | 5,188,000 | 5,555,000 | 6,455,000 | 7,523,000 | 7,512,000 | 6,340,000 |
Short Term Debt | 923,000 | 3,018,000 | 3,681,000 | 4,011,000 | 2,805,000 | 3,958,000 | 3,183,000 | 2,711,000 | 2,962,000 | 4,057,000 |
Tax Payables | 0 | 0 | 0 | 0 | 0 | 0 | 0 | 0 | 0 | 0 |
Deferred Revenue | 3,029,000 | 2,910,000 | 3,710,000 | 3,903,000 | 4,572,000 | 4,259,000 | 5,581,000 | 5,905,000 | 139,000 | 20,000 |
Other Current Liabilities | 1,933,000 | 2,181,000 | 1,422,000 | 922,000 | 1,522,000 | 1,641,000 | 1,797,000 | 1,430,000 | 7,527,000 | 7,259,000 |
Total Current Liabilities | 8,639,000 | 10,696,000 | 11,855,000 | 12,708,000 | 14,087,000 | 15,413,000 | 17,016,000 | 17,569,000 | 18,140,000 | 17,676,000 |
Long Term Debt | 9,864,000 | 11,316,000 | 12,394,000 | 20,278,000 | 19,931,000 | 21,818,000 | 24,571,000 | 22,817,000 | 20,559,000 | 18,916,000 |
Deferred Revenue Non Current | 13,368,000 | 12,469,000 | 11,470,000 | 5,257,000 | 6,923,000 | 9,164,000 | 15,817,000 | 8,047,000 | 4,302,000 | 3,756,000 |
Deferred Tax Liabilities Non Current | 83,000 | 115,000 | 3,029,000 | 4,326,000 | 4,187,000 | 6,742,000 | 488,000 | 3,125,000 | 4,302,000 | 3,772,000 |
Other Non Current Liabilities | 1,359,000 | 1,224,000 | 1,224,000 | 1,804,000 | 1,424,000 | 1,437,000 | 3,847,000 | 3,578,000 | 4,018,000 | 9,423,000 |
Total Non Current Liabilities | 24,674,000 | 25,124,000 | 28,117,000 | 31,665,000 | 32,465,000 | 39,161,000 | 44,723,000 | 37,567,000 | 33,181,000 | 35,867,000 |
Other Liabilities | 0 | 0 | 0 | 0 | 0 | 0 | 0 | 0 | 0 | 0 |
Capital Lease Obligations | 505,000 | 475,000 | 447,000 | 500,000 | 534,000 | 3,427,000 | 3,100,000 | 3,613,000 | 3,859,000 | 3,756,000 |
Total Liabilities | 33,313,000 | 35,820,000 | 39,972,000 | 44,373,000 | 46,552,000 | 54,574,000 | 61,739,000 | 55,136,000 | 51,321,000 | 53,543,000 |
Preferred Stock | 59,000 | 51,000 | 0 | 0 | 0 | 0 | 0 | 0 | 4,000 | 0 |
Common Stock | 9,000 | 9,000 | 9,000 | 9,000 | 9,000 | 9,000 | 9,000 | 9,000 | 9,000 | 9,000 |
Retained Earnings | 5,726,000 | 6,001,000 | 4,879,000 | 5,858,000 | 8,006,000 | 9,105,000 | 6,980,000 | 16,179,000 | 21,326,000 | 21,055,000 |
Accumulated Other Comprehensive Income Loss | -3,594,000 | -3,540,000 | -4,483,000 | -4,867,000 | -4,994,000 | -5,997,000 | -7,113,000 | -3,278,000 | -1,549,000 | -3,749,000 |
Other Total Stockholders Equity | -59,000 | -51,000 | 24,000 | 30,000 | 16,000 | 166,000 | 865,000 | 1,343,000 | -4,000 | -9,000 |
Total Stockholders Equity | 2,141,000 | 2,470,000 | 429,000 | 1,030,000 | 3,037,000 | 3,283,000 | 741,000 | 14,253,000 | 19,786,000 | 17,306,000 |
Total Equity | 2,158,000 | 2,491,000 | 453,000 | 1,060,000 | 3,053,000 | 3,299,000 | 753,000 | 14,269,000 | 19,803,000 | 17,314,000 |
Total Liabilities And Stockholders Equity | 35,471,000 | 38,311,000 | 40,401,000 | 45,403,000 | 49,589,000 | 57,857,000 | 62,492,000 | 69,405,000 | 71,124,000 | 70,857,000 |
Minority Interest | 17,000 | 21,000 | 24,000 | 30,000 | 16,000 | 16,000 | 12,000 | 16,000 | 17,000 | 8,000 |
Total Liabilities And Total Equity | 35,471,000 | 38,311,000 | 40,401,000 | 45,403,000 | 49,589,000 | 57,857,000 | 62,492,000 | 69,405,000 | 71,124,000 | 70,857,000 |
Total Investments | 1,481,000 | 2,469,000 | 1,567,000 | 1,232,000 | 980,000 | 524,000 | 431,000 | 364,000 | 2,013,000 | 2,866,000 |
Total Debt | 10,787,000 | 14,334,000 | 12,394,000 | 20,278,000 | 19,931,000 | 21,818,000 | 27,754,000 | 25,528,000 | 23,521,000 | 26,729,000 |
Net Debt | 8,496,000 | 11,604,000 | 8,918,000 | 16,958,000 | 15,706,000 | 16,580,000 | 21,844,000 | 15,273,000 | 17,919,000 | 23,523,000 |
Currency | USD | USD | USD | USD | USD | USD | USD | USD | USD | USD |
(* All numbers are in thousands)
Fiscal Year | 2014 | 2015 | 2016 | 2017 | 2018 | 2019 | 2020 | 2021 | 2022 | 2023 |
---|---|---|---|---|---|---|---|---|---|---|
Net Income | 3,032,000 | 4,844,000 | 3,431,000 | 4,910,000 | 4,791,000 | 4,440,000 | 1,427,000 | 12,890,000 | 11,548,000 | 6,708,000 |
Depreciation And Amortization | 1,923,000 | 2,084,000 | 2,224,000 | 2,282,000 | 2,207,000 | 2,360,000 | 2,698,000 | 2,953,000 | 3,188,000 | 3,366,000 |
Deferred Income Tax | 385,000 | 540,000 | 123,000 | 1,230,000 | 758,000 | 100,000 | -812,000 | 1,645,000 | 531,000 | 199,000 |
Stock Based Compensation | 536,000 | 574,000 | 591,000 | 584,000 | 634,000 | 915,000 | 796,000 | 878,000 | 1,568,000 | 220,000 |
Change In Working Capital | 288,000 | -254,000 | -709,000 | -1,460,000 | 2,042,000 | 136,000 | 1,081,000 | -664,000 | -420,000 | -514,000 |
Accounts Receivables | -523,000 | -452,000 | -704,000 | -1,022,000 | -421,000 | -717,000 | -1,562,000 | -2,147,000 | -322,000 | 1,256,000 |
Inventory | -2,634,000 | -2,167,000 | -2,585,000 | -3,870,000 | -694,000 | 0 | 0 | 0 | 0 | 0 |
Accounts Payables | 276,000 | -147,000 | 461,000 | 592,000 | 1,034,000 | 419,000 | 904,000 | 1,265,000 | 34,000 | -1,377,000 |
Other Working Capital | 3,169,000 | 2,512,000 | 2,119,000 | 2,840,000 | 2,123,000 | 434,000 | 1,739,000 | 218,000 | -132,000 | -393,000 |
Other Non Cash Items | -438,000 | -358,000 | 813,000 | -6,067,000 | 2,279,000 | 688,000 | 5,269,000 | -2,695,000 | -2,311,000 | 259,000 |
Net Cash Provided By Operating Activities | 5,726,000 | 7,430,000 | 6,473,000 | 1,479,000 | 12,711,000 | 8,639,000 | 10,459,000 | 15,007,000 | 14,104,000 | 10,238,000 |
Investments In Property Plant And Equipment | -2,328,000 | -2,379,000 | -2,965,000 | -5,227,000 | -6,283,000 | -6,380,000 | -5,412,000 | -4,194,000 | -4,769,000 | -5,158,000 |
Acquisitions Net | -88,000 | -1,904,000 | -547,000 | -134,000 | -2,000 | -6,000 | -20,000 | -602,000 | -743,000 | -1,136,000 |
Purchases Of Investments | -3,525,000 | -7,415,000 | -4,816,000 | -1,634,000 | -973,000 | -561,000 | -254,000 | -312,000 | -1,906,000 | -3,521,000 |
Sales Maturities Of Investments | 3,106,000 | 6,388,000 | 5,724,000 | 1,990,000 | 886,000 | 883,000 | 360,000 | 366,000 | 255,000 | 2,701,000 |
Other Investing Activites | 34,000 | 1,000 | 38,000 | 30,000 | 42,000 | 3,000 | 43,000 | 924,000 | -309,000 | -19,000 |
Net Cash Used For Investing Activites | -2,801,000 | -5,309,000 | -2,566,000 | -4,975,000 | -6,330,000 | -6,061,000 | -5,283,000 | -3,818,000 | -7,472,000 | -7,133,000 |
Debt Repayment | -1,694,000 | -2,724,000 | -3,805,000 | -3,939,000 | -2,887,000 | -3,096,000 | -3,392,000 | -2,773,000 | -2,304,000 | -2,272,000 |
Common Stock Issued | 274,000 | 249,000 | 245,000 | 247,000 | 240,000 | 218,000 | 285,000 | 251,000 | 262,000 | 248,000 |
Common Stock Repurchased | -2,695,000 | -2,702,000 | -2,678,000 | -1,813,000 | -1,011,000 | -1,004,000 | -224,000 | -500,000 | -3,500,000 | -2,250,000 |
Dividends Paid | -2,366,000 | -2,525,000 | -2,643,000 | -2,771,000 | -3,011,000 | -3,194,000 | -3,374,000 | -3,437,000 | -5,114,000 | -5,372,000 |
Other Financing Activites | 1,320,000 | 6,137,000 | 5,741,000 | 11,563,000 | 977,000 | 5,349,000 | 2,188,000 | -364,000 | -529,000 | -432,000 |
Net Cash Used Provided By Financing Activities | -5,161,000 | -1,565,000 | -3,140,000 | 3,287,000 | -5,692,000 | -1,727,000 | -4,517,000 | -6,823,000 | -11,185,000 | -5,534,000 |
Effect Of Forex Changes On Cash | -138,000 | -117,000 | -21,000 | 53,000 | -91,000 | 20,000 | 13,000 | -21,000 | -100,000 | 33,000 |
Net Change In Cash | -2,374,000 | 439,000 | 746,000 | -156,000 | 598,000 | 871,000 | 672,000 | 4,345,000 | -4,653,000 | -2,396,000 |
Cash At End Of Period | 2,291,000 | 2,730,000 | 3,476,000 | 3,320,000 | 4,367,000 | 5,238,000 | 5,910,000 | 10,255,000 | 5,602,000 | 3,206,000 |
Cash At Beginning Of Period | 4,665,000 | 2,291,000 | 2,730,000 | 3,476,000 | 3,769,000 | 4,367,000 | 5,238,000 | 5,910,000 | 10,255,000 | 5,602,000 |
Operating Cash Flow | 5,726,000 | 7,430,000 | 6,473,000 | 1,479,000 | 12,711,000 | 8,639,000 | 10,459,000 | 15,007,000 | 14,104,000 | 10,238,000 |
Capital Expenditure | -2,328,000 | -2,379,000 | -2,965,000 | -5,227,000 | -6,283,000 | -6,380,000 | -5,412,000 | -4,194,000 | -4,769,000 | -5,158,000 |
Free Cash Flow | 3,398,000 | 5,051,000 | 3,508,000 | -3,748,000 | 6,428,000 | 2,259,000 | 5,047,000 | 10,813,000 | 9,335,000 | 5,080,000 |
Currency | USD | USD | USD | USD | USD | USD | USD | USD | USD | USD |
(* All numbers are in thousands)
Revenue (TTM) : | 90.745B | P/S (TTM) : | 1.22 | |
Net Income (TTM) : | 6.708B | P/E (TTM) : | 19.56 | |
Enterprise Value (TTM) : | 131.274B | EV/FCF (TTM) : | 30.12 | |
Dividend Yield (TTM) : | 0.05 | Payout Ratio (TTM) : | 0.95 | |
ROE (TTM) : | 0.33 | ROIC (TTM) : | 0.11 | |
SG&A/Revenue (TTM) : | 0 | R&D/Revenue (TTM) : | 0 | |
Net Debt (TTM) : | 20.182B | Debt/Equity (TTM) | 1.56 | P/B (TTM) : | 6.57 | Current Ratio (TTM) : | 1.14 |
Trading Metrics:
Open: | 130.15 | Previous Close: | 129.94 | |
Day Low: | 129.43 | Day High: | 130.58 | |
Year Low: | 121.56 | Year High: | 161.35 | |
Price Avg 50: | 129.41 | Price Avg 200: | 134.77 | |
Volume: | 3.498M | Average Volume: | 4.301M |