Exchange: | NASDAQ |
Market Cap: | 1.473B |
Shares Outstanding: | 22.856M |
Sector: | Consumer Defensive | |||||
Industry: | Household & Personal Products | |||||
CEO: | Ms. Noel M. Geoffroy | |||||
Full Time Employees: | 1927 | |||||
Address: |
|
|||||
Website: | https://www.helenoftroy.com |
Click to read more…
Operator: Greetings. Welcome to Helen of Troy Limited Third Quarter 2025 Earnings Call. [Operator Instructions] As a reminder, this conference is being recorded. It is now my pleasure to introduce Sabrina McKee, Senior Vice President of Business Development and Investor Relations. Thank you. You may begin.
Sabrina McKee: Thank you, operator. Good morning, everyone. Happy New Year, and welcome to Helen of Troy's Third Quarter Fiscal 2025 Earnings Conference Call. The agenda for the call this morning is as follows: I will begin with a brief discussion of forward-looking statements. Ms. Noel Geoffroy, the company's CEO, will comment on business performance and then provide some perspective on current trends. Then Mr. Brian Grass, the company's CFO, will review the financials in more detail and discuss our outlook. Following this, we will open up the call for Q&A. This conference call may contain certain forward-looking statements that are based on management's current expectation with respect to future events or financial performance. Generally, the words anticipates, believes, expects and other similar words are words identifying forward-looking statements. Forward-looking statements are subject to a number of risks and uncertainties that could cause anticipated results to differ materially from the actual results. This conference call may also include information that may be considered non-GAAP financial information. These non-GAAP measures are not an alternative to GAAP financial information and may be calculated differently than the non-GAAP financial information disclosed by other parties. The company cautions listeners not to place undue reliance on forward-looking statements or non-GAAP information. Before I turn the call over to Ms. Geoffroy, I would like to inform all interested parties that a copy of today's earnings release and related investment deck has been posted to the company's website at www.helenoftroy.com and can be found by navigating to the Investor Relations section of the site or by scrolling to the bottom of the home page. The earnings release contains tables that reconcile non-GAAP financial measures to their corresponding GAAP-based measures. I will now turn the conference call over to Ms. Geoffroy.
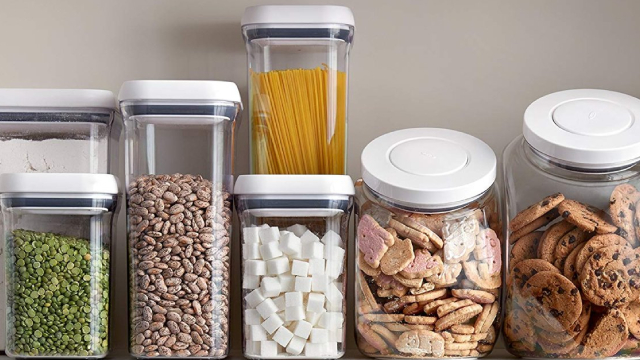
Noel Geoffroy: Thank you, Sabrina. Happy New Year, everyone, and thank you for joining us today. We are pleased with our third quarter results that are within the outlook range we provided in October despite continued cautious consumer spending on discretionary purchases and a weak cough, cold and flu season globally. We are also pleased that our Tennessee distribution facility is running as designed, handling the volume of our heaviest quarter well. We continue to anticipate we will achieve our forecasted labor efficiencies by fiscal year-end. We also made further progress during the quarter on our fiscal '25 efforts to reset and revitalize our brands with improved results, particularly in our Home & Outdoor portfolio. Project Pegasus remains on track with lower year-over-year product and commodity costs having a positive impact on our gross profit margin and providing critical fuel for reinvestment in our brands and business. We also see continued progress on our long-term strategic initiatives. As you may recall, one of those strategic priorities was the formation of the North American regional market organization or [ NA RMO ], which in addition to our international RMO is intended to make our brands more available where the shoppers shop through incremental distribution gains. During the quarter, we continued to benefit from the meaningful net distribution gains won in the first half of fiscal '25 and further expanded distribution in the third quarter. Fiscal year-to-date, we have grown our U.S. weighted distribution by 11% year-over-year. We have also gained a meaningful distribution internationally through a combination of new channels and new distributor partnerships. Another strategic initiative we have made progress on is use of data and analytics across all facets of our business. For example, we continue to use our marketing mix modeling data to prioritize investment opportunities across our brand portfolio and also to select the marketing tactics where we see the best ROI potential. These efforts contributed to market share growth in multiple categories with 7 of our key categories growing or maintaining share this fiscal year through November in our U.S. measured channels and improved POS and share across multiple must-win markets internationally. Another important long-term strategic initiative is to refine and shape our portfolio with a focus on maximizing profitable growth. Subsequent to the end of the third quarter, we announced the closing of our acquisition of Olive & June. We are very excited to add Olive & June to our portfolio of leading brands and to welcome passionate associates and visionary leadership team to the Helen of Toy family. Olive & June is an excellent fit with our goal of continuing Better Together M&A, both strategically and financially. The brand complements our existing beauty portfolio and broadens us beyond the hair category, adding a high-growth and high-margin consumables business that is immediately accretive to Helen of Troy. Olive & June's innovative-driven performance, highly relevant vision of democratizing nail care for everyone, award-winning products and unique consumer engagement model are impressive and inspiring. Most recently, they were awarded Beauty Inc.'s 2024 Breakthrough Beauty brand in Mass, and they introduced a new Gel Polish platform in the third quarter that is outperforming expectations. As we mentioned previously, the Olive & June management team and associates will continue to drive both the strategy and operations of the business, working with the support of Helen of Troy's leadership to fully realize the brand's potential. We see significant growth potential in Olive & June as the team continues to build on the brand's strength in consumer obsession and breakthrough commercial and product innovation in addition to leveraging Helen of Troy capabilities to help expand availability with increased distribution. We will continue to consistently evaluate our brand portfolio and remain disciplined in our approach to shaping it through both acquisitions and potential divestiture to position the company for long-term success and growth. With acquisitions, we will continue to look for brands that have strong global growth potential, are financially accretive and meet our Better Together criteria. Now let's turn to third quarter performance across our portfolio. Home & Outdoor performed very well with growth in all 3 brands. In Wellness, Braun and Vicks remain leaders in their respective categories, even as those categories have been impacted by weak cough, cold and flu season. In Beauty, we know there is more work to be done, but we did make further progress with focused actions to improve the fundamentals of the Beauty business and its brands. International was again a highlight in the quarter with sales growth of 7.5%, primarily driven by strength in Home & Outdoor. Starting with Home & Outdoor. For OXO, growth was driven by distribution gains and continued shelf productivity at Walmart as well as higher international sales, driven by growth in EMEA and LATAM. In October, OXO expansion at Walmart continued across kitchen and organization, notably with the introduction of our pop -- food storage line in over 2,000 Walmart stores. In November, OXO [indiscernible] began an approximately 350-store test at Walmart. It's early days, but we are seeing positive momentum and are excited at this expansion opportunity for our well-regarded top line. OXO continued strong Walmart sales momentum into the holidays with significant sales growth versus the same period a year ago, driven by continued brand momentum and the expanded distribution. OXO also gained additional distribution in the grocery channel. In the U.S., OXO continues to grow its leading market share fiscal year-to-date in its key categories, including kitchen utensils, where the category has normalized post-COVID and post retailer shift from specialty to mass and dry food storage where the category has been hindered by consumers' cautious spending. As mentioned last quarter, we recently launched our OXO Brew Rapid brewer coffee maker, building on the strength of our coffee line and offering a portable option for great-tasting hot coffee or cold brew concentrate in less than 5 minutes. The Rapid Brewer is performing very well with strong POS and was recently the #1 new release in coffee machines on Amazon during the important Thanksgiving Shopping week. We received exciting ERM social media coverage as award-winning and highly respected coffee influencer and barista, Morgan Eckroth, posted a favorable and informative video review of the OXO Brew Rapid Brewer on their YouTube channel, amassing strong engagement. OXO also continues to serve the consumer in trend-right ways with the introduction of ceramic coated metal bakeware in November, just ahead of Thanksgiving. Turning to Hydro Flask. We are pleased with the brand's positive momentum during the quarter, reflecting our focus on revitalizing the brand through innovation, distribution and marketing. Growth in the quarter was driven by initial distribution gains at Target and a new essential hydration tumbler and bottle set offering at Costco. International sales were also strong, fueled by distribution expansion in EMEA, APAC and LATAM as we continue to leverage opportunities to draft off both Osprey and OXO's strength and create stronger distributor partnerships. Hydro Flask e-commerce overdelivered, driven by stronger-than-forecasted POS that lifted post Labor Day replenishment and stronger-than-forecasted performance on Prime Day with Hydro Flask achieving the #1 best seller ranking within water bottles during the event. Hydro Flask continues to win additional shelf space with more permanent placement in both the housewares and sporting goods sections at Target early in the fourth quarter and is extending its presence in Canada. The brand also continues to drive engagement through relevant social media content, highlighting its popular seasonal offerings for the holidays, such as festive colorways, gift sets and personalization options and its sponsorship of the Charli XCX SWEAT tour. We also took the opportunity to remind our consumers of Hydro Flask's long-standing commitments to provide them with top-quality products supported by, for example, the rigorous testing of our 3 leakproof lids. The Flex Sip Lid, the Flex Straw Cap and the Chug cap that fit across our various bottles and tumblers. Osprey continues its momentum in everyday packs. The Daylite Fall 2024 Travel launch has been very successful, helping drive a double-digit sales increase for the Daylite line. The Daylite expandable travel pack has been a top online seller since launch and is receiving strong Amazon reviews. The brand also did well internationally with growth across all regions. We were honored that Osprey was included in Fast Company's list of Brands That Matter 2024 for the brand's commitment to sustainability through its use of recycled content in the main body fabric of 98% of its textile products, connecting people of all sizes with the outdoors with its extended fit collection and for the brand's support of local communities. During the quarter, we also successfully integrated Osprey into our ERP system and our distribution network in the U.S. and Europe. I am pleased to share that we went live with this integration with minimal issues and have been successfully shipping our Osprey B2B and direct-to-consumer business from these facilities. This is an example of our focus on elevating our operational discipline. I am pleased with the team's strong planning and execution of this important integration. Now turning to Beauty & Wellness. For Beauty, many of the key trends we spoke about last quarter continued in the third quarter with POS softness across our portfolio. Looking at the categories, overall growth for both hair appliances and hair liquids is moderating. In hair appliances, we continue to see a bifurcation with demand stronger for high-end appliances at price points above $100. Despite category softness in the below $100 price point appliances, Revlon gained momentum at mass and online, reflecting our value reframing and strong activations for holiday. The Revlon Holiday palette in Walmart from early October through December featured the volumizer and root booster and drove significant year-on-year growth. The Revlon Volumizer remains the #1 selling item in units within the hair appliance category. Drybar launched 3 new holiday kits and the new Triple Shot interchangeable blow dryer brush, which continues to climb in sales and popularity of Amazon and Sephora as one of the brand's top tool SKUs. Looking forward, we believe we have some promising innovation on the appliance side to help bring some news and momentum back to this brand. Curlsmith is benefiting from our incremental growth investments across both innovation and marketing. At the beginning of the quarter, we launched Shake & Shine, a revolutionary curl refreshing mist that is ideal for extending your wash day look. It has quickly become one of Curlsmith's top-selling products. Our data-driven marketing insight tells us that the awareness campaigns we ran ahead of Black Friday had their intended impact. DTC was up significantly, and we saw the biggest lift in new consumers to the brand that we have seen in the last year. Curlsmith's consumer retention is a strength driven by product efficacy and instructional content. We are excited to see our increased focus on top-of-funnel marketing bearing fruit to increase brand awareness. Turning to our Wellness business. As discussed last quarter, we gained new or expanded distribution on Braun Thermometers at CVS, Costco and Walmart, which are all contributing to positive POS trends for the brand. Offsetting this has been a weak cough, cold and flu season. Data indicates that through November, U.S. illness rates are down below the slow start we saw same time last year and at the lowest level in the past 8 years, excluding the COVID anomaly year of 2020 to 2021. Illness rates are similarly low in Europe and APAC. Subsequent to quarter end, data through December 21 shows illness rates have remained below the prior year and well below historic averages. While this is contributing to overall softness in the humidification and thermometry categories, Vicks and Braun have maintained their leading market shares. Vicks remains by far the #1 brand in Rx humidification and Braun and Vicks remain the #1 and #2 brands, respectively, in the thermometry category. In Water Filtration, PUR continues to grow share with strong POS and is gaining share in filter systems as the brand continues to highlight the relevant value reframing message that PUR can save over $75 per month versus bottled water. The brand team also quickly put activation in market to leverage the renewed focus on cleaner drinking water, highlighted by the government's directive for local municipalities to identify and replace lead pipes over the coming decades. As the #1 selling lead reducing filter brand, PUR launched an initiative to educate consumers to help them access cleaner drinking water. The campaign included educational resources available on PUR website and a $25,000 donation to the Water Quality Research Foundation to support education and access to water testing kits for schools in need nationwide. These are great examples of leveraging our leading products with relevant and timely commercial activation. In summary, we remain focused on executing our strategic initiatives while we continue to navigate the challenging and evolving consumer environment. Since we last reported earnings, 3 large retailers have filed for bankruptcy, including the Container Store, which is a meaningful customer for OXO. We also continue to see the widely reported bifurcation in spending between higher income and lower income households. While holiday spending overall is up year-over-year, it is driven by higher income consumers purchasing higher-priced items, while lower income consumers continue to struggle, prioritizing necessities over discretionary goods. We are flexing our portfolio and go-to-market execution to meet our consumers where they are with relevant product assortment and brand messaging. As we discussed, we are on a journey to reset and revitalize our brands. Despite some headwinds in the third quarter from the macro factors I just mentioned, we continue to make progress on our initiatives and the data tells us our investments are bearing fruit. We believe we are building a stronger, more collaborative, data-driven and disciplined Helen of Troy that is better positioned to maximize the potential of our brands globally. Lastly, before I turn it over to Brian, I want to give thanks to everyone at Helen of Troy for being part of why we have earned 2 important recognitions, including a significant jump in ranking to #16 in the 2024 Healthiest 100 Workplaces in America, which recognizes people-first organizations that prioritize the well-being of their associate population and for the third year in a row, recognition by Newsweek as one of America's Most Responsible Companies in 2025. Now I will turn it over to Brian.
Brian Grass: Thank you, Noel, and good morning, everyone. I'm pleased to report results that were within the outlook range for net sales and adjusted EPS we provided in October despite weaker-than-expected winter and illness season. We also increased our gross profit and adjusted operating margins even as we continue to invest in our business for long-term health. During the quarter, growth investment for both product innovation and marketing support increased approximately 140 basis points year-over-year. As Noel mentioned, we are beginning to see the benefits of that growth investment in terms of market share improvement for many of our key brands. After the end of the quarter, on December 16, we announced the closing of the Olive & June acquisition. Olive & June represents a great addition to our portfolio and is immediately accretive to our revenue growth rate, gross profit margin, adjusted EBITDA margin, adjusted EPS and our expected ongoing adjusted EPS growth rate. We borrowed a principal amount of $235 million on our revolver to pay the initial cash consideration of $229.4 million net of cash acquired. As of December 16, 2024, inclusive of these borrowings, we now swapped an aggregate amount of $550 million or 56% of our outstanding floating rate debt to an average fixed SOFR rate of 3.9% through February 2026. Our pro forma net leverage ratio was 3x at the time of closing. I'll now move on to a more detailed discussion of our third quarter results. Consolidated net sales declined 3.4%. Sales in our Home & Outdoor segment increased 4.3% driven by growth in all 3 brands and strength in international. This was more than offset by a decline in Beauty & Wellness, which was unfavorably impacted by a weaker-than-expected winter and illness season during the quarter, which I will further discuss later in my remarks. Consolidated gross profit margin increased 90 basis points to 48.9%. The increase was primarily due to favorable inventory obsolescence expense year-over-year and lower commodity and product costs, partly driven by Project Pegasus initiatives. GAAP operating margin for the quarter was 14.2% compared to 19.5% in the same period last year, which benefited from a gain on the sale of our El Paso facility of $34.2 million or 620 basis points. On an adjusted basis, operating margin increased 30 basis points to 16.6%. The increase was primarily driven by lower annual incentive compensation expense, favorable inventory obsolescence expense year-over-year and lower commodity and product costs, partly driven by Project Pegasus. These factors were partially offset by the incremental growth investment of approximately 140 basis points I referred to earlier and the impact of unfavorable operating leverage. On a segment basis, Home & Outdoor adjusted operating margin increased 150 basis points to 18.4%, driven by favorable inventory obsolescence expense year-over-year, lower annual incentive compensation expense and lower commodity and product costs. These factors were partially offset by incremental growth investments. Adjusted operating margin for Beauty & Wellness declined 100 basis points to 15%, primarily due to incremental growth investment and the impact of unfavorable operating leverage. These factors were partially offset by lower annual incentive compensation expense, lower outbound freight, lower commodity and product costs and favorable inventory obsolescence expense year-over-year. Our tax rate in the third quarter was 21.4% compared to 19.5% last year. The year-over-year increase was primarily due to the impact of Barbados tax legislation enacted during the first quarter of fiscal '25, partially offset by the comparative impact of higher tax expense recognized on the gain on the sale of the El Paso facility in the same period last year. Net income was $49.6 million or $2.17 per share. Non-GAAP adjusted EPS was $2.67 per share reflecting lower adjusted operating income in Beauty & Wellness and a higher adjusted effective tax rate, partially offset by higher adjusted operating income in Home & Outdoor, lower interest expense and lower diluted shares outstanding. We ended the third quarter with total debt of $734 million, a sequential increase of $21 million compared to the second quarter. This reflects higher inventory levels due to the impact of a weaker-than-expected illness season and our strategy to build targeted inventory levels to capture potential demand and to defer potential tariff impacts for production we are transitioning out of China in the near term. We also held more cash on the balance sheet due to the timing of customer payments received at the end of the quarter. Our net leverage ratio was 2.35x, roughly in line with the end of the second quarter. Turning now to our outlook for fiscal '25. We are updating our expectations for consolidated net sales, adjusted EPS, adjusted EBITDA, sales by segment, free cash flow and ending net leverage ratio. There are 2 key changes from our prior outlook. These include an unfavorable revision to our wellness revenue outlook to reflect our expectation that the global illness season will be well below historical averages and the incremental contribution from the Olive & June acquisition. In terms of the impact of illness, we came into the fiscal year assuming an average cough, cold, flu season. Excluding the COVID anomaly year of 2020 to 2021, U.S. illness incidence through December is at an 8-year low, and we are now assuming the season will be well below historical averages for the full year. This adversely impacted our third quarter net sales by approximately $10 million, and we estimate the unfavorable impact to be $15 million to $20 million in the fourth quarter. While there is a possibility that illness incidence could increase, we do not expect retailers to place meaningful incremental replenishment orders as we are now roughly midway through the season. Our outlook now includes an expected incremental net sales contribution in the range of $17 million to $18 million and adjusted EPS in the range of $0.05 to $0.07 from the Olive & June acquisition for the partial period from the date of transaction closing on December 16 through the end of fiscal '25. Olive & June outlook reflects a slower time of year in the typical operating cycle after the holiday selling season. We now expect net sales between $1.888 billion and $1.913 billion, which implies a decline of 5.8% to 4.6% and reflects the 2 key changes I just discussed as well as the previously disclosed unfavorable impact of approximately $5 million due to shipping disruption from the automation start-up issues at our Tennessee distribution facility and the impact of the Curlsmith ERP integration challenges of approximately $3 million in the first quarter. In terms of our net sales outlook by segment, we now expect a Home & Outdoor decline of 0.7% to growth of 0.6%, which continues to include the unfavorable impact of shipping disruption at our Tennessee distribution facility of $5 million during the first quarter and a Beauty & Wellness decline of 10.3% to 9%, which continues to include a year-over-year headwind of approximately 1% related to the expiration of an outlicense relationship and now includes our revised expectation for an illness season well below historical averages as well as the incremental contribution from the Olive & June acquisition. We now expect GAAP EPS of $4.60 to $5.02 for the full year and non-GAAP adjusted EPS in the range of $7.15 to $7.40, which includes estimated accretion of $0.05 to $0.07 from the Olive & June acquisition for the partial post-closing period in our fourth quarter. We now expect full year adjusted EBITDA of $292 million to $295 million, which includes an estimated contribution in the range of $3 million to $4 million from the Olive & June acquisition. Our adjusted EBITDA outlook implies margin compression of approximately 130 to 140 basis points year-over-year with approximately 50 basis points coming from the automation start-up issues at our distribution facility. We continue to make incremental investment into product innovation and marketing for the long-term health of our business, and we are preserving the year-over-year dollar increase in growth investment spending, which now translates to a range of 120 to 130 basis points as a percentage of sales. With respect to Project Pegasus, as Noel mentioned, we remain on track with our savings targets and cadence and expect that restructuring charges will be largely completed in fiscal '25. We now expect full year interest expense of approximately $50 million to $52 million, which includes the impacts of additional debt borrowed for Olive & June acquisition, the interest rate swaps executed in the third quarter and recent interest rate decreases made by the Federal Reserve. We expect a GAAP effective tax rate range of 25.8% to 27.6% for the fiscal year and a non-GAAP adjusted effective tax rate range of 18.6% to 19.4%. We now expect capital and intangible asset expenditures of between $33 million and $36 million for fiscal '25, which includes remaining equipment and technology of $12 million to $13 million associated with our Tennessee distribution facility. We now expect free cash flow in the range of $145 million to $155 million which reflects key changes from our previous outlook. The lower overall revenue and weaker illness season is expected to unfavorably impact our full year cash flow results compared to our prior expectation. We also begun to further build strategic inventory levels in advance of potential tariffs, as I mentioned earlier, which was not included in our previous outlook. We now expect net leverage ratio, as defined in our credit agreement, to be between 2.85x and 2.75x by the end of fiscal '25. In closing, we've seen progress in our efforts to reset and revitalize our business in fiscal '25 while ensuring that we are set up for success in the future. As we look forward to fiscal '26, we believe that many of our investments and initiatives are beginning to bear fruit. Automation system at our Tennessee distribution facility is now fully functional, and we expect to realize significant efficiency gains and scale for years to come. We improved our portfolio with the completion of the Olive & June acquisition after the end of the quarter, which we believe will be an accretive growth contributor to Beauty and Wellness, while we continue to work on improving the fundamentals of the core business. We've enhanced key processes that we believe will unlock greater working capital efficiency, and we'll look for opportunities to further optimize our balance sheet to quickly pay down debt and consider further accretive capital deployment. Our initiative to diversify our supplier base outside of China is making solid progress with more opportunities on the horizon. We generated significant investment fuel with Pegasus and are now focused on optimizing our investments to achieve maximum returns and productivity going forward. Finally, we intend to build on the momentum of Pegasus with the next phase of ongoing productivity initiatives and system enhancements, create further investment fuel, offset potential tariff impacts and drive earnings accretion. With that, I'll turn it back to the operator.
Operator: [Operator Instructions] Our first question is from Bob Labick with CJS Securities.
Bob Labick: Yes. So I wanted to start with Iron Giant, with the distribution center. Obviously, congrats on getting the kind of headwinds behind you here. Could you remind us of the kind of benefits now that you expect? What benefits should you get? How long does that take? And how does the O&J acquisition impact your distribution centers and Iron Giant in particular, if at all?
Noel Geoffroy: Thanks, Bob. I'll start, and then I'll ask Brian to build from there. Overall, as you know, we've -- the Iron Giant or Tennessee distribution center has been a major investment and a big project for us for some time, and we're excited about the capability that it provides us in a myriad of ways, both in full case volume for the Home & Outdoor business which we've been shipping out of TNBC for quite some time very well and then also in kind of the less than full case or direct-to-consumer business for Home & Outdoor as well. So that was that last piece that -- was the automation that was kind of coming up towards the end. It was the last piece of the distribution facility we had to get working that we struggled with in quarter 1. Really pleased with the team's efforts to get that working, particularly during this really busy holiday period, and we were able to accomplish that quite nicely. I think at this point, when it comes to Olive & June and how it will impact that acquisition, as we talked about when we made the acquisition, we haven't assumed that in yet. I think over time, we probably will and can bring some productivity to their direct-to-consumer business, that pretty substantial direct-to-consumer business, but we are not currently assuming that. We are currently assuming that we're going to operate Olive & June as they are, a bit as a stand-alone and then look for those kinds of opportunities over time. So I would say that will be upside, if you will, when we get to that point. Brian, do you want to build?
Brian Grass: Yes, I would add by saying the vision for the benefit from Iron Giant is similar to what we laid out. It remains the same, actually, from what we laid out in the Investor Day materials. It's just been delayed a bit by the automation challenges that we had and had to get through. So in those materials, we kind of called out our distribution cost as a percentage of sales being in the 5-plus percent range and the vision after we get Iron Giant to peak efficiency and make the other distribution moves that we have planned is that we go to a rate of more like in the mid-3s, 3.5%-ish as a percentage of sales over time. So we still think we're on track to achieve that benefit. It's just taken a little bit longer as we had to get through the last speed bump that we had. And then just a little bit on Olive & June, if you compare our cost of doing distribution to what they're currently incurring, there is a pretty big opportunity there. We'll be careful to pursue that opportunity. And I think we're starting the partnership of doing less is more kind of thing. But as Noel said, we see meaningful opportunity there to add some efficiency and squeeze out some more accretion, which we have not factored into any of our kind of pro forma estimates or forecasts, so it would be upside going forward.
Bob Labick: Okay. Super. And then as my follow-up, next question, you touched on this briefly as it relates to tariffs. But how do you plan for tariffs when you don't know what they're going to be or how they're going to be and things like that? You mentioned some inventory, maybe you can elaborate there. But just give us your latest thoughts on how you guys go about planning. This is like a macro question for everyone. It's not specific to you. But for an event that may or may not happen at a magnitude that could be considerably different and all that kind of stuff.
Noel Geoffroy: Yes. Thanks, Bob. I'll start briefly and then turn it over to Brian. But I think I would just echo what you said. I think there are changing stories right now on what that's going to look like and what areas and what products the tariffs may or may not be effective on, what the magnitude of the tariffs would be, whether the tariffs would be targeted on only China or more broadly than that. And so the inauguration is literally days away. So I think we'll get some more clarity once President-elect Trump is in office and we know exactly where he's going. That said, we do believe that diversification is a smart move for us, and that's what we are pursuing, and I'll let Brian kind of touch on where we are and some of those levers, Brian?
Brian Grass: Yes. I think what Noel ended with there is the key point. What we try to do is ask ourselves the question of does it make sense to make the change even without tariffs so that we're not in a position where we regret transitions or changes that we made and tariffs don't come to be in these particular categories. So that's kind of our North Star is it's a broader concept in our mind, which is diversification outside of China and not being so concentrated. That's really the theme that we're using to make our choices. And in every case where we're looking at making a transition out of China, asking ourselves a question of, does it make sense even if tariffs don't come to be? So it is a difficult algorithm to solve when you don't know where it's totally going. Recent reports have said that it may be more focused on items -- certain sectors deemed critical to national or economic security, which would probably exclude a lot of our categories, but there are reports that are contrary to that. We just think the level of diversification that we're pursuing makes sense either way.
Operator: Our next question is from Peter Grom with UBS.
Peter Grom: Two for me. I guess I just want to start on kind of the fourth quarter. I'd love to just get some perspective on kind of the underlying drivers from a top line perspective. It seems like a pretty wide range with, call it, 2 months to go here. So can you maybe just walk us through the underlying assumptions a bit more? What would put you at the high end versus the lower end? And I guess it doesn't really sound like there's a lot of room for that $15 million to $20 million headwind from lower illness to change. So just kind of curious what the key variables we should be watching over the next couple of months are?
Noel Geoffroy: Peter, what I would say -- what I see in the fourth quarter is continued strength in Home & Outdoor. I'm pleased with the progress that we're making there. We saw growth in the third quarter on all 3 brands. We're seeing some sequential improvement on Hydro Flask. We're seeing share growth on OXO in its 2 key categories, kitchen utensils and dry food storage. Osprey also continues to be strong across all regions and nice share growth in its extended travel and everyday lifestyle packs. And so I look to see continued improvement and continued progress along those lines in Home & Outdoor. On the Beauty & Wellness side, you touched on it, the very low global illness that we're seeing is really impacting our wellness business. We do have strong brand positions, Vicks in Rx humidifiers and then Braun and Vicks in thermometers are both gaining share, maintaining very strong positions. But the categories are just way down based on kind of that 8-year low with the exception of that COVID year and similarly low seasons in EMEA and APAC. And so that's really the biggest driver in the change in our outlook for the fourth quarter there. We have baked in softer performance on beauty. And I would say what we saw in the third quarter was in line with what we forecasted. And so I feel like we forecasted where our business is on beauty. The real driver of the change here is the illness season. Brian, anything you'd like to add?
Brian Grass: No, I would just say that the environment continues to be pretty highly variable, and there's customers of ours that are doing better, and there's other customers that are not doing as well. And that variability kind of with the consumer and the retailers is part of the explanation as to why the range might be a little bit wider than you were expecting.
Peter Grom: Makes sense. Okay. And then just -- I guess just looking ahead here, this year has been reset and revitalized. But kind of where are we in that process? And just going back to the targets outlined at the Investor Day, I mean, do you think those targets or growth rates outlined are still achievable at this point in time? And if so, when do you kind of expect we could see that? And I guess what I'm really trying to get at is, should we anticipate fiscal '26 being another year of this kind of continued reset and revitalize and kind of growth below that long-term algorithm? Or do you think it's plausible that we can kind of approach those targets as we look out to next year? I know that's a lot of moving pieces, and we'll get more color in April. But just anything we should be kind of thinking about as we sit here today as it relates to '26?
Noel Geoffroy: Yes. Peter, what I would say right now is the long-term targets that we have out there stand. We haven't revised them. Now as you also ended your question, we're in the midst of our budgeting process right now, and we'll be sharing our outlook for fiscal '26 in late April. So that will be the moment I think that we'll be able to provide a lot more color on what we're seeing in fiscal '26. I think -- I continue, as I just said, Home & Outdoor, I feel like is moving in the right direction. International is moving in the right direction. I think Wellness has underlying stability, but a lot of our brands are subject to the seasonal -- whether it's illness season or other events that can swing that are harder for us to control or predict, if you will. And then the Beauty business, we've got more work to do, and I think we're making some progress. We've got some, I would say, green shoots on the less than $100 hair appliances, Revlon performance in mass is solid, could be better, but solid. Where we really have some room for improvement is on those appliances over $100 where a lot of the growth is, and that's still a work in progress. So that's sort of how I'm seeing the portfolio and where we are in the journey overall. And I think we can give you more perspective on how we see that shaping up numerically and longer term as we come in late April. Brian, anything you would add?
Brian Grass: No, perfectly said.
Operator: Our next question is from Rupesh Parikh with Oppenheimer & Company.
Rupesh Parikh: So just going back to some of the distribution gains you're seeing, OXO, Hydro Flask, et cetera. Just want to get a sense of how the velocities are performing at the new distribution that you're winning?
Noel Geoffroy: Rupesh, Happy New Year. Great to hear your voice. So distribution gains, clearly, in Home & Outdoor, we've gotten some major distribution gains, and they're into retailers who represent significant category volume. So the potential with that kind of distribution gain to expand our household penetration, our velocity, our market share are really significant. And I'll kind of talk to maybe OXO and Hydro Flask as 2 examples that are at a bit of a different point in where we are. OXO kitchen utensils, as you know, in Walmart has been in distribution a little bit longer. So we've got more perspective and more data that can inform us there. And what we see is double-digit household penetration expansion for OXO since we made that move. So that tells us that it is meaningfully expanding the footprint of the brand because Walmart's share of the kitchen utensil category is pretty significant. So we're reaching a much broader audience of consumers by being in distribution at Walmart. The velocity has been quite strong there. We see overall market share growth since we've expanded into Walmart. And all of that strong performance is earning the brand kind of more opportunities to expand into other OXO categories. As I mentioned in my remarks, Pop containers have gone into the home organization part of Walmart. We've got a top test going, et cetera. So all of that is exactly what I want to see when we think about expanding distribution. On the Hydro Flask side, I would say it's a little bit too early to tell on what we're doing there. What we do know is in the insulated beverage category, the category is growing in customers like Target and Costco. Because as we think about how that category is evolving from sports enthusiasts into more women, Gen Z consumers, et cetera, they shop a lot at those customers. And so we know that's where the category is growing there. It's declining or flat in kind of the historic sports and outdoor channel. So similar to OXO, it's the right place for the brand to be because that's where the category is. Our distribution for Hydro Flask in Target very initial. We have some off-shelf placement. We expect to get broader placement, in fact, it's kind of shipping now, if you will, in home and the sporting goods. So I think we'll have a lot more perspective a few months down the line once that takes hold and we see what the velocity is doing. I would say on Costco, we have a little bit more data. I think I mentioned this last quarter that the initial program did show strong velocity such that Costco ordered a replenishment beyond what we initially forecasted for the double pack that we had in Costco. So that's kind of how I would characterize the performance of the distribution.
Rupesh Parikh: Great. And my one follow-up question is just on the Olive & June acquisition. Brian, you gave the accretion benefits for this year. Is there a way to help us quantify what the carryover benefits are into next year related to the accretion, I guess, for Q1, Q2 and Q3, presumably?
Brian Grass: Yes. Without providing specific guidance, which we're not doing yet, I think you can get somewhat of an idea from the accretion based on what we gave you in Q4. I think you'd have to account for the fact that, that's a partial period of about 70 days and that it's also a softer period in their operating cycle post the holiday selling season. The transaction closed on the 17th, we really didn't get any benefit of holiday selling in our results. Those sales all occurred prior to the closing date. The other thing I think you'd have to factor in is they're growing quickly. So if you're focused on EPS, you have to factor in some level of EPS accretion growth throughout next fiscal year. So that's how I would try to get your arms around the level of accretion with respect to kind of EPS, I'll call it. And then as we implied in our announcement, adjusted EBITDA margin is north of 20% before any synergies. And as we talked about, there's likely synergies with respect to distribution and other areas. And so that's positive. And their gross profit margin is between 60% and 70%, which we really like. So that's how I kind of would think about accretion without getting into specific guidance for next year, which we're not prepared to do.
Operator: Our next question is from Olivia Tong with Raymond James.
Olivia Tong Cheang: Great. Happy New Year. Just first, a few points of clarification. In terms of the bifurcation between high end versus low to mid-end consumer, is that worsening in your view? Or is your point that it continues to be a headwind? And then secondly, you talked about a few trends last quarter that seemed quite encouraging, a return to replacement cycle in home, the shelf space gains for OXO, innovation for Hydro Flask, you touched on a couple of these today as well. As you continue to rebuild some of these businesses, is there an opportunity in your view for shelf to be a net positive over the next 12 months? Or do things like weaker cough, cold, The Container Store bankruptcy, things like that sort of push the sales inflection out even further as we think about fiscal '26?
Noel Geoffroy: Olivia, Happy New Year. I would say from a macro consumer standpoint, I would largely say it's a continuation, although I mean, things are always shifting. As you look at some of the macro data out there, there was a rebound in consumer confidence that wasn't really sustained in December as the index kind of dropped back to the middle of the range, the expectations index, kind of that consumer short-term outlook for income business and labor went down quite a bit in December. So I think there's some data out there that consumer is definitely still concerned, cautious. And as mentioned, I think that's particularly most of what we see in our business and what I think is reported widely is it's that middle to lower income consumer that's feeling that pressure the most, the higher income consumer is a bit insulated from that. So roughly the same as what we've been seeing, although some of those more recent reports would indicate that December maybe was a little bit worse in the consumer's mindset than where we were trending prior to December. And then your second question, I think, was around some of the positives and then some of the headwinds. I think -- yes, I do see some positive tailwinds for us with the distribution gains that I talked about, a couple of them with OXO and Hydro Flask in particular, where we're gaining meaningful placement in important retailers from a category perspective. One of the key strategies that we have is be and win where the shopper shops. If you're not in a retailer where the category is quite developed, that's a gap. And so that's been a real focus for us in the North American RMO to close those gaps and some of the ones we've talked about today are meaningful ones. So I think that's a real positive and will continue to be a tailwind. It's our responsibility to continue to bring the right assortment, the right promotions, the right programming so that the velocities perform once we're in those retailers so that we see that kind of continue to boost forward. I think when it comes to the wellness part of the portfolio, we do have businesses that are susceptible to the illness season and those things kind of ebb and flow. Typically, at the beginning of each fiscal year, we assume an average season. It's difficult to really do anything other than that. And then it varies as it does year-on-year. This year happens to be kind of an 8-year low. So that as we think about next year, I don't see why we wouldn't again assume an average season. That's kind of how we start every fiscal year as we go into it. And then on Beauty, we have more work to do. As I said, I see a few places where we're beginning to make improvement. I talked about this last quarter. We did change leadership in the Beauty and Wellness business unit and that new leader is really digging in across the portfolio. We've got some new innovation coming at the higher-end appliances on Drybar that we're enthusiastic about. So I see some things coming and some work happening that I anticipate should improve the performance, but it doesn't happen overnight.
Operator: Our next question is from Susan Anderson with Canaccord Genuity.
Susan Anderson: I guess maybe just a follow-up on the Beauty segment on the liquids, you mentioned some strength there. I guess, was that across both Drybar and Curlsmith. And then I think maybe you got more space with Drybar in retailers. Did that flow through in the quarter? And I guess how is that performing?
Noel Geoffroy: Susan, thanks for joining us. I would say on hair liquids, Curlsmith continues to be a good, strong, steady performer. It is a leading brand in the textured hair segment, continues to do well. As I mentioned in my remarks, we didn't lean into Curlsmith with some incremental investment leading into the holiday season that did well for us. It's a brand that has really strong consumer retention based on product efficacy, our really strong consumer education. Speaking from personal experience, curly hair is a bit of a journey. And so it's helpful when brands like Curlsmith really show consumers how to use products and how to achieve certain styles and it's the strength of Curlsmith. And so as we put more money behind the brand, we see it respond positively. So I feel like Curlsmith continues to perform well. On Drybar liquids, I would say, we've got pockets of strong performance. Drybar Big Brew. I've mentioned that -- I think I mentioned that last quarter is a relatively new collection on Drybar that focuses on thickening. That has continued to perform very well for us, up significantly and doing well. I would also say the Drybar liquid glass collection is up after broadening the portfolio of that. That's performing well for us. So I think there are pockets of -- certain subsegments within the Drybar liquids that are doing well. I'd like the whole portfolio to kind of rise, and I've talked about this before, that synergy between tools and liquids, I think, is a unique position for Drybar and something that the team continues to work on, especially as we bring out more news on tools. I think that kind of double regimen play is where Drybar can really shine.
Susan Anderson: Okay. Great. And then just one follow-up question on inventory. It looks like it was up in the quarter. Just curious the drivers there. And then just inventory at retail as well, do you feel like there's any areas that are over-inventoried? Or are you guys feeling pretty good about inventory at retail?
Noel Geoffroy: Brian, I'll let you touch on our inventory, and then I can touch on retailer inventory, if you want.
Brian Grass: Sure. Yes, our inventory is higher, and it's higher than we were expecting at this point in the year, and there are kind of 2 primary factors driving that. One is we had made a decision to kind of lean in, in some areas where we thought we had demand opportunities. One of those is in thermometry where we built strategic inventory to serve that market, for a variety of reasons. And with the weaker cough, cold, flu season, we're going to end up with higher inventory at this point in the year. And I would expect it to carry through the remainder of the year because most likely the season is largely done from a retailer replenishment order perspective. So that's one factor. The other factor is in conjunction with our tariff strategy, in cases where we have line of sight to make a supplier transition out of China, but could use more time managing those transitions, we did make the decision and have begun to execute the acquisition or the build of more inventory levels which buys us more time before a potential impact so that we can make the supplier transitions and minimize the impact before the transition is made. So we did -- that is a change from our previous outlook as well as impact of the cough, cold, flu season on inventory levels as we close the year. So I would call those the 2 primary drivers with respect to inventory.
Noel Geoffroy: And then, Susan, I would say on the retailer side, from a retailer inventory standpoint, probably not surprising based on what we've talked about on the weak illness season, wellness is where we see some retailer inventory build due to that weakness. So that's -- as Brian said, I think, in his prepared remarks, even if the illness season accelerates in the next couple of months, they've got a lot of inventory on hand. We have plenty of inventory, as he also just said. So if it really spikes and retailers start to replenish, we are ready to service it. But I would say, at this point, their inventory levels are high on the wellness side. I think in other parts of our business, retailers continue to kind of react to the pressured consumer. As I talked about earlier, they do continue to use sort of some of these just-in-time inventory replenishment strategies. So sometimes we'll see some shifts that happen based on that. But the place that probably has the highest inventory right now from our category standpoint is wellness due to the illness season.
Operator: With no further questions in the queue, I would like to turn the conference back over to management for closing remarks.
Noel Geoffroy: Thank you, everyone, for joining us today and for your continued interest in Helen of Troy. We really look forward to speaking with many of you this week as well as next week at the ICR Conference and the virtual CJS Conference. Thanks, everyone, and have a great day.
Operator: Thank you. This will conclude today's conference. You may disconnect your lines at this time, and thank you for your participation.
Subscribe now to gain full access to the earnings summary, 5 years analyst estimates and more exclusive content.
Subscribe NowWARNING: AI-generated summary.
While this is a phenomenal tool that can save you time and provide meaningful insights and key takeaways from the earnings call, it may contain inaccuracies or misinterpretations. For precise information, please refer to the original transcript.
(* All numbers are in thousands)
Fiscal Year | 2015 | 2016 | 2017 | 2018 | 2019 | 2020 | 2021 | 2022 | 2023 | 2024 |
---|---|---|---|---|---|---|---|---|---|---|
Revenue | 1,445,131 | 1,545,701 | 1,537,219 | 1,489,747 | 1,564,151 | 1,707,432 | 2,098,799 | 2,223,355 | 2,072,667 | 2,005,050 |
Cost Of Revenue | 845,572 | 909,696 | 861,751 | 867,646 | 923,045 | 972,966 | 1,171,497 | 1,270,168 | 1,173,316 | 1,056,390 |
Gross Profit | 599,559 | 636,005 | 675,468 | 622,101 | 641,106 | 734,466 | 927,302 | 953,187 | 899,351 | 948,660 |
Research And Development Expenses | 7,400 | 10,000 | 11,800 | 13,500 | 13,000 | 17,800 | 30,600 | 37,200 | 47,800 | 56,500 |
General And Administrative Expenses | 340,440 | 362,790 | 367,836 | 292,135 | 269,341 | 316,902 | 359,112 | 371,457 | 359,498 | 313,536 |
Selling And Marketing Expenses | 88,400 | 136,600 | 130,900 | 143,600 | 168,800 | 195,000 | 277,900 | 308,800 | 300,700 | 308,200 |
Selling General And Administrative Expenses | 428,840 | 499,390 | 498,736 | 435,735 | 438,141 | 511,902 | 637,012 | 680,257 | 660,198 | 621,736 |
Other Expenses | 517 | 299 | 414 | 327 | 340 | 394 | 559 | 260 | 249 | 0 |
Operating Expenses | 428,840 | 499,390 | 498,736 | 435,735 | 438,141 | 511,902 | 637,012 | 680,257 | 660,198 | 688,071 |
Cost And Expenses | 1,274,412 | 1,409,086 | 1,360,487 | 1,303,381 | 1,361,186 | 1,484,868 | 1,808,509 | 1,950,425 | 1,833,514 | 1,744,461 |
Interest Income | 0 | 504 | 0 | 0 | 11,719 | 12,705 | 12,617 | 12,844 | 40,751 | 0 |
Interest Expense | 15,022 | 11,096 | 14,857 | 13,951 | 11,719 | 12,705 | 12,617 | 12,844 | 40,751 | 53,065 |
Depreciation And Amortization | 39,653 | 42,749 | 36,175 | 33,730 | 29,927 | 39,091 | 44,613 | 45,409 | 54,385 | 51,499 |
EBITDA | 210,372 | 173,674 | 209,707 | 226,792 | 231,592 | 217,621 | 322,283 | 313,459 | 266,280 | 321,221 |
Operating Income | 161,719 | 130,615 | 164,332 | 169,062 | 199,379 | 178,251 | 281,488 | 272,550 | 211,791 | 260,589 |
Total Other Income Expenses Net | -14,505 | 3,524 | -13,947 | -13,624 | -11,379 | -12,311 | -12,058 | -12,584 | -40,502 | -51,547 |
income Before Tax | 147,214 | 119,818 | 149,889 | 155,438 | 188,000 | 165,940 | 269,430 | 259,966 | 171,289 | 209,042 |
Income Tax Expense | 16,050 | 18,590 | 9,200 | 26,556 | 13,776 | 13,607 | 15,484 | 36,202 | 28,016 | 40,448 |
Net Income | 131,164 | 101,228 | 140,689 | 44,446 | 168,545 | 152,333 | 253,946 | 223,764 | 143,273 | 168,594 |
Eps | 4.590 | 3.580 | 5.110 | 1.630 | 6.460 | 6.060 | 10.160 | 9.270 | 5.980 | 7.060 |
Eps Diluted | 4.520 | 3.520 | 5.040 | 1.630 | 6.410 | 6.020 | 10.080 | 9.170 | 5.950 | 7.030 |
Weighted Average Shares Outstanding | 28,579 | 28,273 | 27,522 | 27,077 | 26,073 | 25,118 | 24,985 | 24,142 | 23,955 | 23,865 |
Weighted Average Shares Outstanding Diluted | 29,035 | 28,749 | 27,891 | 27,254 | 26,303 | 25,322 | 25,196 | 24,410 | 24,090 | 23,970 |
Currency | USD | USD | USD | USD | USD | USD | USD | USD | USD | USD |
(* All numbers are in thousands)
Fiscal Year | 2015 | 2016 | 2017 | 2018 | 2019 | 2020 | 2021 | 2022 | 2023 | 2024 |
---|---|---|---|---|---|---|---|---|---|---|
Cash And Cash Equivalents | 12,295 | 225,800 | 23,087 | 20,738 | 11,871 | 24,467 | 45,120 | 33,381 | 29,073 | 18,501 |
Short Term Investments | 0 | 0 | 0 | 539 | 512 | 0 | 0 | 0 | 3,941 | 0 |
Cash And Short Term Investments | 12,295 | 225,800 | 23,087 | 20,738 | 11,871 | 24,467 | 45,120 | 33,381 | 29,073 | 18,501 |
Net Receivables | 222,916 | 217,899 | 229,416 | 275,914 | 280,280 | 348,023 | 389,169 | 463,053 | 382,762 | 402,410 |
Inventory | 293,081 | 301,609 | 289,122 | 251,511 | 302,339 | 256,311 | 481,611 | 557,992 | 455,485 | 395,995 |
Other Current Assets | 36,468 | 9,780 | 21,937 | 9,545 | 10,369 | 54,035 | 56,037 | 27,654 | 24,721 | 27,012 |
Total Current Assets | 564,760 | 772,724 | 556,078 | 555,311 | 604,859 | 682,836 | 971,937 | 1,082,080 | 892,041 | 843,918 |
Property Plant Equipment Net | 126,068 | 130,465 | 134,935 | 123,503 | 130,338 | 164,752 | 169,068 | 243,137 | 390,544 | 372,608 |
Goodwill | 549,727 | 583,005 | 698,929 | 602,320 | 602,320 | 739,901 | 739,901 | 948,873 | 1,066,479 | 1,066,730 |
Intangible Assets | 398,430 | 375,751 | 419,489 | 302,915 | 291,526 | 300,952 | 357,264 | 537,846 | 553,883 | 536,696 |
Goodwill And Intangible Assets | 948,157 | 958,756 | 1,118,418 | 905,235 | 893,846 | 1,040,853 | 1,097,165 | 1,486,719 | 1,620,362 | 1,603,426 |
Long Term Investments | 0 | 0 | 0 | 2,201 | 218 | 23 | 33 | 2,918 | 1,816 | 1,190 |
Tax Assets | 2,132 | 1,605 | 1,955 | 16,654 | 7,991 | 14,635 | 21,748 | 3,628 | 2,781 | 3,662 |
Other Non Current Assets | 12,638 | 6,093 | 1,710 | 18,416 | 12,283 | 784 | 3,537 | 4,969 | 6,171 | 13,818 |
Total Non Current Assets | 1,088,995 | 1,096,919 | 1,257,018 | 1,066,009 | 1,044,676 | 1,221,047 | 1,291,551 | 1,741,371 | 2,021,674 | 1,994,704 |
Other Assets | 0 | 0 | 0 | 0 | 0 | 0 | 0 | 0 | 0 | 0 |
Total Assets | 1,653,755 | 1,869,643 | 1,813,096 | 1,621,320 | 1,649,535 | 1,903,883 | 2,263,488 | 2,823,451 | 2,913,715 | 2,838,622 |
Account Payables | 98,564 | 103,713 | 105,652 | 129,341 | 143,560 | 152,674 | 334,807 | 308,178 | 190,598 | 245,349 |
Short Term Debt | 21,900 | 22,644 | 24,404 | 1,884 | 1,884 | 5,525 | 7,856 | 7,639 | 13,184 | 14,510.999 |
Tax Payables | 6,850 | 6,938 | 6,564 | 0 | 1,427 | 1,181 | 7,022 | 20,718 | 14,778 | 17,821 |
Deferred Revenue | 131,870 | 132,847 | 146,427 | 130,989 | 1,427 | 139,304 | 213,190 | 0 | 0 | 0 |
Other Current Liabilities | 134,551 | 134,306.999 | 152,747 | 168,261 | 165,160 | 179,516 | 265,207 | 266,155 | 193,598 | 173,130.001 |
Total Current Liabilities | 261,865 | 268,758 | 289,367 | 297,089 | 312,031 | 338,896 | 614,892 | 602,690 | 412,158 | 450,811 |
Long Term Debt | 411,307 | 597,270 | 461,211 | 287,985 | 318,900 | 378,282 | 380,098 | 855,077 | 971,020 | 696,683 |
Deferred Revenue Non Current | 7,091 | 8,298 | 6,560 | 6,736 | 0 | 0 | 0 | 0 | 0 | 0 |
Deferred Tax Liabilities Non Current | 52,711 | 44,120 | 20,091 | 7,096 | 5,748 | 4,224 | 5,735 | 21,582 | 28,048 | 41,253 |
Other Non Current Liabilities | 23,307 | 26,615.001 | 21,661 | 14,691 | 16,219 | 20,758 | 23,416 | 16,763 | 13,678 | 12,433 |
Total Non Current Liabilities | 487,325 | 670,842 | 502,963 | 309,772 | 340,867 | 403,264 | 409,249 | 893,422 | 1,012,746 | 750,369 |
Other Liabilities | 0 | 0 | 0 | 0 | 0 | 0 | 0 | 0 | 0 | 0 |
Capital Lease Obligations | 0 | 0 | 0 | 0 | 0 | 44,502 | 44,324 | 49,500 | 49,792 | 45,522.999 |
Total Liabilities | 749,190 | 939,600 | 792,330 | 606,861 | 652,898 | 742,160 | 1,024,141 | 1,496,112 | 1,424,904 | 1,201,180 |
Preferred Stock | 0 | 0 | 0 | 0 | 0 | 0 | 0 | 0 | 0 | 0 |
Common Stock | 2,849 | 2,774 | 2,703 | 2,658 | 2,495 | 2,519 | 2,441 | 2,380 | 2,399 | 2,375 |
Retained Earnings | 721,858 | 728,527 | 798,130 | 780,494 | 746,366 | 898,166 | 965,166 | 1,021,017 | 1,164,188 | 1,284,229 |
Accumulated Other Comprehensive Income Loss | -76 | 665 | 1,173 | 631 | 1,191 | -7,005 | -11,656 | 202 | 4,947 | 2,099 |
Other Total Stockholders Equity | 179,934 | 198,077 | 218,760 | 230,676 | 246,585 | 268,043 | 283,396 | 303,740 | 317,277 | 348,739 |
Total Stockholders Equity | 904,565 | 930,043 | 1,020,766 | 1,014,459 | 996,637 | 1,161,723 | 1,239,347 | 1,327,339 | 1,488,811 | 1,637,442 |
Total Equity | 904,565 | 930,043 | 1,020,766 | 1,014,459 | 996,637 | 1,161,723 | 1,239,347 | 1,327,339 | 1,488,811 | 1,637,442 |
Total Liabilities And Stockholders Equity | 1,653,755 | 1,869,643 | 1,813,096 | 1,621,320 | 1,649,535 | 1,903,883 | 2,263,488 | 2,823,451 | 2,913,715 | 2,838,622 |
Minority Interest | 0 | 0 | 0 | 0 | 0 | 0 | 0 | 0 | 0 | 0 |
Total Liabilities And Total Equity | 1,653,755 | 1,869,643 | 1,813,096 | 1,621,320 | 1,649,535 | 1,903,883 | 2,263,488 | 2,823,451 | 2,913,715 | 2,838,622 |
Total Investments | 0 | 0 | 0 | 2,201 | 218 | 23 | 33 | 2,918 | 1,816 | 1,190 |
Total Debt | 433,207 | 623,907 | 485,615 | 289,869 | 320,784 | 380,166 | 381,982 | 856,961 | 977,084 | 702,933 |
Net Debt | 420,912 | 398,107 | 462,528 | 269,131 | 308,913 | 355,699 | 336,862 | 823,580 | 948,011 | 684,432 |
Currency | USD | USD | USD | USD | USD | USD | USD | USD | USD | USD |
(* All numbers are in thousands)
Fiscal Year | 2015 | 2016 | 2017 | 2018 | 2019 | 2020 | 2021 | 2022 | 2023 | 2024 |
---|---|---|---|---|---|---|---|---|---|---|
Net Income | 131,164 | 101,228 | 140,689 | 128,882 | 174,224 | 152,333 | 253,946 | 223,764 | 143,273 | 168,594 |
Depreciation And Amortization | 39,653 | 42,749 | 44,341 | 33,730 | 29,927 | 37,409 | 37,718 | 35,829 | 44,683 | 51,499 |
Deferred Income Tax | -1,830 | -464 | -7,254 | 21,264 | 7,636 | -5,696 | -4,400 | -8,871 | -2,242 | 13,210 |
Stock Based Compensation | 5,974 | 8,483 | 15,498 | 15,054 | 22,053 | 22,929 | 26,418 | 34,618 | 26,753 | 33,872 |
Change In Working Capital | -7,552 | 8,357 | 19,103 | 1,948 | -34,844 | 19,299 | -18,230 | -152,639 | -15,566 | 53,525 |
Accounts Receivables | -9,487 | -3,604 | -6,827 | -34,379 | -5,784 | -57,424 | 33,416 | -66,834 | 83,624 | -18,668 |
Inventory | 2,274 | -17,606 | 18,967 | 29,366 | -50,828 | 45,482 | -220,817 | -45,913 | 110,304 | 58,192 |
Accounts Payables | 16,502 | 7,044 | 5,797 | 23,689 | 14,219 | 7,166 | 175,784 | -43,745 | -115,931 | 54,403 |
Other Working Capital | -16,841 | 22,523 | 1,166 | -16,728 | 7,549 | 24,075 | -6,613 | 3,853 | -93,563 | -40,402 |
Other Non Cash Items | 11,194 | 24,908 | 16,124 | 23,329 | -3,693 | 45,019 | 18,654 | 8,122 | 11,341 | -14,633 |
Net Cash Provided By Operating Activities | 178,603 | 185,261 | 228,501 | 224,207 | 195,303 | 271,293 | 314,106 | 140,823 | 208,242 | 306,067 |
Investments In Property Plant And Equipment | -6,521 | -20,603 | -20,619 | -13,605 | -26,385 | -17,759 | -98,668 | -78,039 | -174,864 | -36,644 |
Acquisitions Net | -195,943 | -43,150 | -209,267 | 13 | 1,138 | -255,861 | 0 | -366,180 | -144,538 | 1,620 |
Purchases Of Investments | 0 | 0 | 0 | 0 | 0 | 0 | 0 | 0 | 0 | -9,605 |
Sales Maturities Of Investments | 0 | 0 | 0 | 0 | 0 | 0 | 0 | 0 | 0 | 622 |
Other Investing Activites | -6,521 | 7 | 32 | 49,239 | 1,138 | 3 | -98,668 | 5,305 | 69 | 49,456 |
Net Cash Used For Investing Activites | -202,464 | -63,746 | -229,854 | 35,634 | -25,247 | -273,617 | -98,668 | -438,914 | -319,333 | 5,449 |
Debt Repayment | 240,600 | 190,700 | -133,200 | -197,000 | 29,900 | 16,900 | 7,100 | 468,600 | 120,668 | -269,076 |
Common Stock Issued | 0 | 0 | 0 | 0 | 0 | 0 | 0 | 0 | 0 | 0 |
Common Stock Repurchased | -273,599 | -100,000 | -75,595 | -73,053 | -217,493 | -10,169 | -203,294 | -188,204 | -18,365 | -55,222 |
Dividends Paid | 0 | 0 | 0 | 0 | 0 | 0 | 0 | 0 | 0 | 0 |
Other Financing Activites | -872 | 6 | 7,435 | 7,863 | 8,670 | 8,189 | 1,409 | 5,956 | 4,480 | 2,210 |
Net Cash Used Provided By Financing Activities | -33,871 | 91,990 | -201,360 | -262,190 | -178,923 | 14,920 | -194,785 | 286,352 | 106,783 | -322,088 |
Effect Of Forex Changes On Cash | 0 | 0 | 0 | 0 | 0 | 0 | 0 | 0 | 0 | 0 |
Net Change In Cash | -57,732 | 213,505 | -202,713 | -2,349 | -8,867 | 12,596 | 20,653 | -11,739 | -4,308 | -10,572 |
Cash At End Of Period | 12,295 | 225,800 | 23,087 | 20,738 | 11,871 | 24,467 | 45,120 | 33,381 | 29,073 | 18,501 |
Cash At Beginning Of Period | 70,027 | 12,295 | 225,800 | 23,087 | 20,738 | 11,871 | 24,467 | 45,120 | 33,381 | 29,073 |
Operating Cash Flow | 178,603 | 185,261 | 228,501 | 224,207 | 195,303 | 271,293 | 314,106 | 140,823 | 208,242 | 306,067 |
Capital Expenditure | -6,521 | -20,603 | -20,619 | -13,605 | -26,385 | -17,759 | -98,668 | -78,039 | -174,864 | -36,644 |
Free Cash Flow | 172,082 | 164,658 | 207,882 | 210,602 | 168,918 | 253,534 | 215,438 | 62,784 | 33,378 | 269,423 |
Currency | USD | USD | USD | USD | USD | USD | USD | USD | USD | USD |
(* All numbers are in thousands)
Revenue (TTM) : | 2.005B | P/S (TTM) : | 0.79 | |
Net Income (TTM) : | 168.594M | P/E (TTM) : | 13.03 | |
Enterprise Value (TTM) : | 1.515B | EV/FCF (TTM) : | 12.34 | |
Dividend Yield (TTM) : | 0 | Payout Ratio (TTM) : | 0 | |
ROE (TTM) : | 0.07 | ROIC (TTM) : | 0.06 | |
SG&A/Revenue (TTM) : | -0.07 | R&D/Revenue (TTM) : | 0.03 | |
Net Debt (TTM) : | 733.954M | Debt/Equity (TTM) | 0.03 | P/B (TTM) : | 0.92 | Current Ratio (TTM) : | 1.92 |
Trading Metrics:
Open: | 67.06 | Previous Close: | 65.9 | |
Day Low: | 64.25 | Day High: | 67.1 | |
Year Low: | 48.05 | Year High: | 127.83 | |
Price Avg 50: | 65.8 | Price Avg 200: | 74.6 | |
Volume: | 373930 | Average Volume: | 415822 |