Exchange: | NYSE |
Market Cap: | 57.793B |
Shares Outstanding: | 1.437B |
Sector: | Basic Materials | |||||
Industry: | Copper | |||||
CEO: | Mr. Richard Carl Adkerson | |||||
Full Time Employees: | 27200 | |||||
Address: |
|
|||||
Website: | https://fcx.com |
Click to read more…
Operator: Ladies and gentlemen, thank you for standing by. Welcome to the Freeport-McMoRan Third Quarter Conference Call. At this time, all participants are in a listen-only mode. Later, we will conduct a question-and-answer session [Operator Instructions] I would now like to turn the conference over to Mr. David Joint, Vice President, Investor Relations. Please go ahead, sir.
David Joint: Good morning, everyone. And welcome to the Freeport conference call. Earlier this morning, Freeport reported its third quarter 2024 operating and financial results. A copy of today's press release with supplemental schedules and slides is available on our Web site, fcx.com. Today's conference call is being broadcast live on the Internet. Anyone may listen to the conference call by accessing our Web site homepage and clicking on the webcast link. In addition to analysts and investors, the financial press has been invited to listen to today's call. A replay of the webcast will be available on our Web site later today. Before we begin our comments, we'd like to remind everyone that today's press release and certain of our comments on the call include non-GAAP measures and forward-looking statements and actual results may differ materially. Please refer to our cautionary language included in our press release and slides and to the risk factors described in our SEC filings, all of which are available on our Web site. Also on the call with me today are Richard Adkerson, Chairman of the Board; Kathleen Quirk, President and Chief Executive Officer; Maree Robertson, Executive Vice President and CFO, and other senior members of our management team. Richard will make some opening remarks, Kathleen will review our slide materials, and then we'll open up the call for questions. Richard?
Richard Adkerson: Thanks, David. Thanks everyone for joining us. It was a solid quarter as you can see and that's the result of the good work that our global Freeport team has accomplished and really proud of them and look forward to the future. We've got great outlook for our company, great outlook long term for our copper and commodity that we base our strategy on. So Kathleen will review with you the results of the quarter and talk about it, and we're making progress with this fire we had at our new smelter in Indonesia and we'll review that as well. We have a new president in Indonesia, Prabowo Subianto. When Prabowo was General three decades ago, we worked together closely on issues affecting our operations in Papua. He knows our business. He's appointed cabinet, which includes a number of cabinet members from Joko Widodo’s cabinet and other people that we've known over the years. We look forward to working with him and believe his understanding of our business and of our location in Papua will be a big benefit as we work with this administration going forward. Kathleen, I'll turn the call over to you to review our results and our outlook.
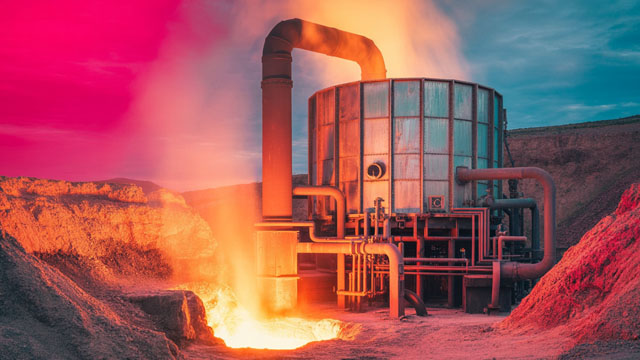
Kathleen Quirk: Okay, great. Thank you, Richard. And I'm going to start on our slide presentation, starting on Slide 3 with our highlights for the third quarter and first nine months of 2024. Our team continues to deliver on our operating plans and pursue value through enhancing efficiencies, managing costs aggressively and building value in our organic growth portfolio. You'll see here we generated strong margins and cash flows during the quarter with $2.7 billion in EBITDA and $1.9 billion in operating cash flows. Our operating performance was supported by sales volumes exceeding guidance for both copper and gold and favorable unit cash cost performance compared to both our guidance and the year ago quarter. We're focused on initiatives to build value from organic growth. At Freeport, we benefit from a large reserve and resource position with near term, medium term and longer term embedded growth options. The high potential innovative leach technologies are delivering results and we've several ongoing initiatives to add scale and low cost copper volumes in our Americas business. In the first nine months of 2024, the incremental copper production from our leach initiative was nearly 70% higher than the comparable period last year, and we have additional projects underway to build scale and improve on our US cost position. We're also advancing our brownfield expansion opportunities position the business for long term growth to supply a market with increased requirements for copper. During the third quarter, we purchased 5.3 million shares of Cerro Verde in at market transactions on the Peruvian Stock Exchange at a cost of $210 million and that allowed us to increase our ownership in this highly attractive asset from the prior level of 53.6% to 55%. The public flow of Cerro verde now represents about 4.3% of the outstanding shares. We ended the quarter in a strong position financially. And as we look forward, we're very optimistic about the markets we serve, our portfolio of high quality copper assets and the future prospects for strong cash flow generation to support investments and value enhancing projects and returns to shareholders. We'll talk about markets on Slide 4. Copper prices again during the third quarter traded in a broad range. On the LME, they range between 3.91 and 4.47 per pound. And on the COMEX exchange range from 3.94 per pound to 4.66 per pound. The settlement prices on the LME for the quarter averaged $4.18 per pound. As we look at the quarter and where prices traded, they largely followed macro sentiment, which weighed global economic data and economic pressures in China against actions by the Fed and other central banks to cut interest rates and the potential for large economic stimulus in China. At the micro level, we continue to see secular demand trends associated with electrification, providing strong demand for copper and offsetting the impact of a cyclical slowdown. In the US, our customers continue to report strong demand for power cable and building wire associated with substantial investment in electrical infrastructure and AI data centers. This growing sector more than offset weakness in traditional demand sectors in residential construction and autos. Demand from China continues to be supported by significant investments in the electrical grid and continued growth in China's production of electric vehicles. Notably, China's demand for copper continues to grow despite a weak property sector. Recent announcements for economic stimulus in China to support the country's economic growth targets could provide further support for metals demand as we move through 2024 and into 2025. As we've discussed in the past, Copper is a foundational metal and a key component of electrification. It's physical characteristics and superior connectivity make it essential to electrification. New massive investment in the power grid, renewable generation, technology infrastructure and transportation are driving increased demand for copper and forecast call for above trend growth and demand for the foreseeable future. As we look at these fundamentals of demand and match it up with supply, we continue to see a tightly balanced market in the near term and deficit conditions longer run. This is going to require new investments and innovative technologies to build supplies longer term and at Freeport, we’ve driven supply of copper reliably and responsibly to a growing market. With our leading industry position, our large scale current operations and our future growth pipeline, we're well positioned to benefit from this fundamental outlook for copper. I remind everyone that in addition to copper, we're also a major gold producer and are benefiting from increasing gold prices. We'll turn to operations on Slide 5, where we summarize the quarterly operating results by geographic region. In the US, we are continuing to take actions to improve efficiencies and cost performance to mitigate the impact of lower grades. We have more work to do but recent trends are improving. We're closely monitoring key performance indicators and seeing positive trends in recent months in asset efficiency associated with key areas of loading, hauling, crushing and stacking. Our equipment reliability is a focus area and we're making strides in reducing unplanned downtime. We're also rationalizing the use of contractors to reduce costs and allocating internal resources to our key focus areas. In addition, success in our leaching initiative and further scaling incremental low cost production will also drive reductions in our cost structure. In South America, the team at the Cerro Verde operation posted another solid quarter. Mill throughput exceeded 420,000 metric tons of ore per day during the quarter and our mill recovery improved from last year's third quarter. Our unit net cash costs were slightly less than last year's third quarter after excluding the $0.12 per pound nonrecurring charge in the quarter for a new labor agreement. After reaching agreement with Cerro Verde's second union, we now have multiyear labor agreements covering Cerro Verde's hourly workforce. Mentioned earlier we purchased additional Cerro Verde shares that gives us more exposure to this established long lived and high quality assets. In Indonesia, results were quite strong and that's evidenced by a unit net cash credit of $0.71 per pound. The team is consistently delivering strong volumes of both copper and gold from our large scale underground ore bodies. Our sales in the quarter were higher than our estimates going into the period with increased mill rates and oil grades. We also benefited from strong gold sales in the quarter, reflecting good production performance and a reduction in inventory from June 30th levels. Our near term focus areas include continued strong execution of our operating plans, commissioning of a value driven copper cleaning circuit at our site in Papua to support strong mill recoveries and commissioning the precious metals refinery. We're also working to restore smelter operations following the recent smelter fire event, which we'll talk about more on the next slide. Just an update on where we are with the smelter. We made good progress during the third quarter on our commissioning and start-up. This is a project that our team managed construction in a challenging market in a very effective manner. But we did experience a setback last week on October 14th from a fire incident in a gas cleaning facility used in the sulfuric acid production process. Our safety protocols were effective and the fire was extinguished in a short period of time without injury to our personnel. Start-up activities have been temporarily suspended as a result while we conduct damage and root cause assessments and develop our recovery plans. We've presented a picture on the slide that you can review. But as you can see, the incident affected a relatively small area of the overall project. We have teams actively engaged in planning the repairs and assessing lead times for replacement equipment. We expect that the repair cost will be covered by our insurance programs and we're also working with the Indonesian government on continuity of concentrate exports during the outage. Our mining operations in Papua have not been impacted and our team is focused on restoring smelter operations safely and expeditiously. We look forward to achieving our objective of being a fully integrated producer in Indonesia, which positions us to secure a long term extension of our operating rights there. Really continue to be very excited about our innovative leach initiative. On Slide 7, you can see that early results continue to indicate significant value potential. Just a reminder, we achieved our initial targeted run rate of 200 million pounds per annum of copper per annum at the end of last year and are now driving initiatives to scale this initiative to 300 million to 400 million pounds per annum in the next couple of years. Ultimately, our goal was to achieve 800 million pounds per annum from this value enhancing growth initiative. This is the size of a major new mine with low capital investment required, low incremental operating costs and that will significantly enhance the value and competitive position of our Americas production. You can see on the slide, the significant growth in incremental volumes from these initiatives over the last several quarters, our results have been achieved by enhancing heat retention in the leach stockpiles using data from sensors and analytics to identify targets and through deploying new operational tactics to direct solution injection to areas that were previously inaccessible. We continue to build confidence in boosting the run rate to 300 million to 400 million pounds per year during 2026. Some of the examples of the initiatives that are now underway that will add volumes in the future include expanding our surface area under leach by using helicopters to install irrigation in areas previously inaccessible under conventional techniques and by scaling our targeted solution injection wells. We're making great progress on our leach injection technology, great progress on our drilling. We're drilling much more efficiently and we're able to increase the rate of well development. In parallel, we're also advancing innovation driven initiatives which would support our ultimate objective of reaching 800 million pounds per annum. We believe there's significant opportunity from increasing heat to the stockpiles. We're looking at adding heat to the leach solution using external energy or using pyrite hosted ores to generate additional heat. Heat is a proven source to improve recoveries in this type of application. We're also continuing to advance testing of new additives at scale and we look forward to reporting to you on our progress on these initiatives. At Freeport, we're really well positioned to capture the value of this opportunity with an extensive inventory of substantial residual copper from material already mined, an industry leading technical team with expertise in leaching technology and a strong multi-disciplined innovation team dedicated to this initiative. We've got additional opportunities for growth beyond the leach opportunity, and you can see that on Slide 8, where we list our organic growth projects. All of these projects are brownfield opportunities where we're leveraging existing assets and established operations. The leach initiative that we just talked about is our best opportunity to grow in the near term and we're pursuing this initiative very aggressively. In the US, we also have opportunities for expansion at our Bagdad and Safford Lone Star operations. And at Bagdad, we're advancing investments in automation, tailings and energy infrastructure and expanded employee housing in this remote location to position us to execute the project more efficiently when the time is right. We don't have major permitting hurdles and this is really a straightforward option. We're monitoring conditions and progress with our derisking initiatives and continue to expect to be in a position to make a decision next year on the expansion plans. In the Safford Lone Star District where we have a very large resource, we're engaged in studies to define a brownfield expansion. We're targeting opportunities to more than double current production levels, which are currently around 300 million pounds per annum. The large resource that we have at this location, it gives us an opportunity for Safford Lone Star to become a generational cornerstone asset for Freeport and Arizona in the next decade. At El Abra in Chile, this is our partnership with Codelco, as we previously reported, we completed pre-feasibility studies and we're in the process of preparing an environmental impact statement which we expect to be completed by the end of next year. The project involves investment in a new concentrator of scale similar to the size of Cerro Verde that we installed nearly 10 years ago, investments in the desalinization and pipeline system to support our water requirements. This project is large. It would provide 750 million pounds of annual copper production and 9 million pounds of annual molybdenum production. It's a long lead project. It would require something on the order of seven to eight years because of the time frame for permitting in Chile. And we're going to continue to review economics in the context of market conditions but we believe this is a project that will be required in the future to support long term copper demand trends, and this is a project in our portfolio that Freeport can execute. In Indonesia, we continue to progress our large scale Kucing Liar development. This is a very large ore body adjacent to our existing operations, our existing ore bodies in Papua. We expect to commence production by 2030. We're also conducting exploration below our Deep MLZ ore body. We're getting encouraging results. We expect that an extension of our operating rights in Indonesia beyond 2041 will set us up for additional long term development options in this highly attractive district. By pursuing all of these initiatives and advancing them, we're really focused on building optionality for future growth. We're going to continue to be disciplined in our approach and focused on targeting opportunities that can be executed over time that enhance long term value. Our Slide 9 shows our three year outlook, which we show every quarter and keep updated. This is the outlook for sales of copper, gold and molybdenum and that you'll see the sales guidance is very similar to our previous outlook. We also have updated our estimates for our unit net cash cost. We expect our average for 2024 to approximate $1.58 per pound. That is below our July estimate of $1.63 per pound and similar to our guidance at the start of the year of $1.60 per pound. We've got some details of this information by region on Slide 19 and the reference materials. So as we move to cash flows, margins and cash flows and putting together our projected volumes and cost projections on Slide 9 -- Slide 10, we show modeled results for EBITDA and cash flow at various copper prices ranging from $4 to $5 per pound. These are modeled results using the average of 2025 and 2026 with our current volume projections and cost estimates and holding gold flat at $2,600 per ounce and molybdenum flat at $20 per pound. You'll see here that annual EBITDA at $4 copper would range from $11 billion and it would go to approximately $15 billion per annum at $5 copper. Our operating cash flows at these product ranges would be over $7 billion at $4 copper to $10.5 billion at $5 copper. We've got sensitivities that we've presented on the right of this chart. You'll note that we're highly leveraged to copper price with each $0.10 per pound equating to about $420 million in annual EBITDA. We're also leveraged to gold and will benefit from improving gold prices with each $100 change in gold prices approximating $150 million in annual EBITDA. With long live reserves, large scale production, Freeport is well positioned to generate substantial cash flow to fund future organic growth and cash returns under our performance based payout framework. Moving to the next slide, on Slide 11, we're showing our current forecast for capital expenditures for this year and next. Capital expenditures for 2024 are forecast at about $3.6 billion and we estimate capital expenditures for next year to total about $4.2 billion. You'll see there have been some timing shifts between the two years but over the two years the changes are not material. We'll note that the discretionary projects over this two year period totaled $2.5 billion. This is a category that reflects the capital investments we're making in new projects that under our financial policy are funded with the 50% of available cash that's not distributed. They're value enhancing projects, growth projects, provide good returns and they're detailed on Slide 23 in our reference materials. As we look forward, we're going to continue to be disciplined in deploying capital and really focused on those opportunities that build value in our business. And finally, on Slide 12, we reiterate the financial policy priorities centered on a strong balance sheet, cash returns to shareholders and investments in value enhancing growth projects. We've got a very solid balance sheet, investment grade ratings from all three agencies, strong credit metrics and flexibility within our debt targets to execute on projects. We've distributed $4.5 billion to shareholders through dividends and share purchases since implementing this framework, got a very attractive future long term portfolio that will enable us to continue to build value for shareholders. Our global team is very focused on driving value. We're committed to strong execution of our plans, providing cash to invest in profitable growth and returns to shareholders. Thanks for everyone for your attention. And now I would like to open the call to take your questions.
Operator: [Operator Instructions]. Our first question comes from the line of Chris LaFemina with Jefferies.
Chris LaFemina: Just wanted to ask a couple of questions about Indonesia. And first, on smelter fire with the insurance. Kathleen, you mentioned that the insurance would cover the costs for repairs. What if there is a situation where there's a delay to being able to export concentrate? Do you have any business interruption insurance that might cover the cost of loss shipments or any insurance that might cover the incremental royalties that you had have to pay on concentrate on exports?
Kathleen Quirk: The policy that we're referring to is a construction insurance policy that does not have business interruption coverage. It does cover the cost of the repairs. This is not a -- as you can see from the picture, it's not a big area of the affected facilities, it is an essential area. The process is essential to the overall production of copper, refining of copper, but it's not a large part of the overall facility. So our focus, Chris, really is getting the repairs done as quickly as possible. We do have discussions with the government. It's in everyone's interest that the concentrate continue. We do have some flexibility within our existing quota of what we can ship through 2024 but we'll be asking for additional flexibility to make sure that we can we can ship everything that we produce in 2024. And then depending on the time frame that it takes to restore operations, we'll work with the governments for continuity in the portion of 2025 that will be affected, it's in everyone's interest. As you run through the math, the government gets essentially through taxes and royalties and dividends over 70% of the economics or the cash flow. So it will be in everyone's interest for this to continue and we'll work hard to get this operation restored as quickly as possible. But in the interim, we expect that we'll continue to be able to export.
Chris LaFemina: And then just secondly, on Indonesia as well. So the $1 billion of restricted cash, which I think is what 30% of the export proceeds and it's held for 90 days in Indonesian banks. Does that restricted cash policy continue even after the smelter ramps up? And can you just remind us of kind of the background behind that and what the reason for that cash restriction is?
Kathleen Quirk: Chris, it refers to all exports. So it doesn't just affect copper, it affects all exports in Indonesia required to hold in bank accounts for 90 days, temporarily your export proceeds. And it was a measure taken last year by the government to look at its currency and fiscal situation. And so it don't -- not only applies to us but implies the oil companies and other people that are exporting. So that will continue unless the regulation has changed that will continue beyond 2020 -- beyond the smelter startup. But it is there. We're earning returns on the investments. It's there temporarily. We withdraw it after 90 days. And so right now, it's just held in deposit. But that's something that the government will continue to consider in light of its objectives.
Operator: Our next question comes from the line of Liam Fitzpatrick with Deutsche Bank.
Liam Fitzpatrick: A couple more on the smelter, I'm afraid. Firstly, I appreciate you're still assessing the situation. But can you give some high level guidance on the length of delay that we're talking about, is it three months, could it be substantially longer than that? And then in terms of the government reaction, do you think -- and the export extension, do you think this will be just a formality and received in good time or could there be a risk that it could be delayed beyond the year end? And then a quick one just separate to the smelter on the Cerro Verde stake increase, it's small but probably the best type of M&A that you can do. Is this a one-off or do you think there could be more opportunities to increase your stake?
Kathleen Quirk: On the time frame for the repairs, we don't have that information yet. This is a event that happened essentially a week ago and our teams have been on the ground inspecting the damaged equipment, determining what needs to be replaced, what does not need to be replaced. And we're working in parallel with our vendors on understanding lead times for various equipment. The early results in terms of the area affected, not everything on the structure was damaged. We were fortunate we did not have big impacts to structural steel. There will be some equipment and piping that needs to be replaced. And so we're just working through that right now, trying to understand what the lead times are for this equipment. This is not equipment off the shelf. So will need to be fabricated and we'll work quickly. The fortunate thing is right now it's not a time in the market where supply chains are real tight. So we're getting really good response from our vendors, working to understand the root cause of this and when the vendors are involved in that exercise with us as well. So we don't have a specific time frame other than to assure you that we've got the right teams in place. We've got the right organization that's working through this in a professional way to expedite what we can and get this back up and running so that we can achieve our start-up goals. The government has been supportive, they sent -- we have our own fire department there at the site. But the government also sent support and has been very supportive. They've been looking also -- the police, this was normal procedure, looking at the investigation of the causes and we're collaborating on that exercise as well. I think if you look at the world and these smelters, this is not the first time there's been a fire. In Indonesia, the people that we are talking with understand the hazards involved in these types of operations. We're working hard and designing these operations so that they don't have hazards. But if you look at history, there have been have been other similar type incidents. So they understand it, they understand our good faith and getting the smelter completed. And they also understand the economics that this -- continuity will benefit them as we go forward. So I think we'll just continue to work collaboratively to make sure that all of the -- the impacts of this are mitigated, and they can be mitigated through insurance and through continued exports. And that's what we want to make sure that we do to every extent possible is mitigate the impact of this incident. With the Cerro Verde question, Cerro Verde has a public market trades in the relatively small float that trades on the Peruvian Stock Exchange. And so we're interested in buying more if there's opportunities to do it. There were some funds that were interested in selling and we were able to pick up those shares. But it's a high quality asset, very difficult to replicate. And so to the extent there are opportunities to purchase additional shares, we're interested in doing that but that takes a willing seller as well. So we'll just continue to monitor that as we go forward.
Operator: Our next question will come from the line of Bob Brackett with Bernstein Research.
Bob Brackett: A question back to Indonesia but this is around IUPK. If I overly analyze the 2Q versus 3Q, there was an expectation that you might file for IUPK extension in 2024 in the 2Q release but in 3Q, it feels a little more vague. Am I over-interpreting or is there anything about the end of the year and filing that, that matters to you specifically?
Richard Adkerson: Definitely -- let me make one comment here first. We had hoped, based on discussions that go back a couple of years that we would be able to accomplish this during the term of Joko Widodo. And with everything that went on with the transition to the new president, the election occurred months ago but the transition was occurred later, we just weren't able to get it. There's an established regulation in place that provides us the ability to file for and we'll be working with the new government and working on the right time to do that, we feel confident that it will happen.
Bob Brackett: A quick follow-up. Can you tease us a little with the pre-feasibility study launched on Safford Lone Star, what should really broad goalposts, what sort of opportunity should we think about?
Kathleen Quirk: This is a very large resource. We've been doing a lot of drilling over the last several years and have identified a resource that is multiples of the current reserve. And it's in an established area. It's over the mountain range from Morenci where we've operated for a century more. And Safford is relatively new. I mean it's one of the newest mines in the US, we brought it online in 2007, '08 time frame and then have expanded it to date. So what we have is this opportunity to a vision where you could have another cornerstone asset in this district where we've got talented workforce. We've got an established community support and we've got a resource. And so you could have an operation there that is both doing leaching, which that's what -- it's 100% leach operation today, but could add additional milling there to essentially double the production, the resource might support even more than doubling. But what we're looking at is the opportunity to go from 300 million pounds of copper a year there to $600 million and through efficient leaching and milling operation. And so what we're doing now is designing, based on the resource, what the next step would be in terms of expanding the operation. And we're all very excited about it. We're pushing to really define what it could be. We know from the resource, it could be something that will be with us for a very long time. And so that's the objective. We're doing the pre-feasibility study work and we'll have more information next year about what a project could look like. One of the things that is important to recognize here is it's not like El Abra. In that El Abra is going to -- El Abra is a very attractive project, but it takes a long time because of the permitting requirements. We don't have the same degree. We don't believe we'll have the same degree of permitting required for this that you would have in something like El Abra. So it's possible that if this is fast tracked, it could come online not too much different than where El Abra. So that's exciting as well. We're fortunate at Freeport that we have these brownfield opportunities. We have big resources. We have the community support that allows us to grow, and that's what we're doing. We're focused on technology. We're focused on automating what we do to make sure that we can be as efficient as possible long term. And I think technology, not only in our leach initiative but also in our mining initiatives is going to turn the corner and make our US operations much more attractive as we go forward. So that's -- we're working on that in parallel with these studies.
Operator: Our next question comes from the line of Michael Dudas with Vertical Research Partners.
Michael Dudas: Maybe you could shed -- I appreciate the comments about North America and the impact on some of your initiatives on the cost side. But maybe you could give a sense of how quickly some of these efficiency initiatives will be moving forward, looking at the marketplace for labor, where do you stand on that? And is there a normalized level or expectation away from the improvement from the leaching contribution that we'd see a moderation in the mining cost, of course, recognizing that the great issues that you've been dealing with?
Kathleen Quirk: Well, over the last several quarters, we've had two -- it's been twofold. One is we -- starting in '22, we’ve had rising costs, and that came at a time when we started getting into lower grade. So we've had two things that we've been dealing with. The good news is that we're not seeing the rise in costs like we were previously. And actually, there's some things that -- like energy that have come -- that are actually -- have trended lower. But the thing we're focused on now is making sure that our assets are as productive as possible. We did some benchmarking against our South America operations and back in 2022, the two were pretty much on top of each other in terms of their unit costs. Now when we look at the comparison, there's a big gap between South America and North America and that's mainly this great issue. We haven't had the grade decline in South America like we've had in North America, but that requires us to be more efficient and we think we can do that. We think that we can be more productive with our equipment, more productive with our people as our people are getting better training, more experience, that is a big help. The other issue that we're making some progress on is downtime. We've had some experience in recent years with premature equipment failures. We're turning the corner on that. We're focused on systems and planning our downtime so that when we do go down for planned maintenance that the downtime is delivered, the projects delivered on the cost we expected and in the time frame we expected. But it's a lot of basics but we're making progress. When we look at all the KPIs that we track, the key performance indicators that we track, we're seeing better utilization, better availability on our equipment than we've experienced in recent quarters. And that's just going to have to continue to be the case that we have to work day in, day out to achieve better asset availability and productivity metrics. The other thing we're focused on is contractor costs. We've had some labor rate increases that have not been insignificant but the contractor costs have been even more significant. So what we're doing there is we're reducing the amount of contractors that we have in our operations. We're down about 10% or so from where we were and we're allocating our own internal resources differently to reduce costs there that will be something we're continuing to work on. The other thing we're doing in our global supply chain group is leading an effort to really push back what's happened over the last couple of years with component parts and all aspects of maintenance supplies. People are trying to push through cost increases, price increases on equipment and parts. And we just don't see the data that supports that. So we're pushing back on that. We're looking to bring costs back down to reasonable levels where our vendors can generate returns but not egregious returns. So we've got multifaceted, multifaceted initiatives going on. As you mentioned, the leach initiative is one component of that and that's going to help a lot. But there are other areas that we've got teams focused on. And we will make progress if we continue to follow these key performance indicators and achieve these targets that we've set out that each of our teams know about, know what we need to do, we will bring down the cost even though grades may not improve. So that's something that we're committed to. And I think you'll start to see in 2025 all other things being equal in terms of input costs but you'll see our unit cost trending lower in the US compared to where they are now. And I'll ask Josh or Maree, either of you, if you want to add to anything I commented on, on costs. This is a big effort for our whole team. So anybody else want to comment, please do.
Josh Olmsted: Kathleen, I think you touched on everything that I was going to touch on. I mean really the laser focus by the team on efficiencies, productivities and managing our costs via contractor spend are really key in driving our unit cost down in addition to the work in the maintenance and reliability space. The more reliable our equipment is, the more productive it is and therefore, that just helps all the way across the board, not only from a deviser perspective but also from a cost perspective, because when equipment is down it typically costs more. So you touched on the things that are the most important for us. And we're very, very focused organizationally on those key performance indicators so that we can manage that stuff on a day-to-day, week-to-week, month-to-month basis and drive it in the direction we need to go.
Operator: Our next question comes from the line of Orest Wowkodaw with Scotiabank.
Orest Wowkodaw: My question is around the same lines with respect to cost. I mean with North American cost above $3 and South America around $2.50, I understand that you're working on some cost reduction initiatives. But should we think about sort of the go forward run rate for costs in North America more in the $2.50 to $3 range post these initiatives with South America more in the $2.25 to $2.50 a pound? Like is that just the new reality of today's cost environment?
Kathleen Quirk: I think directionally, that's right. Now to the extent that we can bring down some of these input costs, that will help but I think that is what you're saying is accurate. Now I want to remind everybody that our leach initiative, if we're successful there and continuing to scale that's a big deal. So you're talking about costs in the US for average today in the $3 range, this leach initiative is bringing on incremental pounds at a cost of less than $1. And so that will bring down the average as we scale it more, because the reason why it's so attractive is because this is getting more copper out of what's already been mined. So the mining cost is a big part of the overall cost of copper production. And this is taking advantage of material that's already been mined and investing some incremental costs to get more. So that could really make a difference. And that's why we're talking about it so much and we're making progress on it, it could it could really change the cost structure in the US. And we've got some opportunities for leach, in particular, at El Abra that we're pursuing but the meaningful impact will be in our US operations, principally Morenci and Safford and our Chino mine.
Orest Wowkodaw: Just as a follow-up to that, I mean, we've seen North American costs creep up seemingly quarter-over-quarter. Where do you see that inflection point? Should we -- do you think we peaked here at 3.14 a pound or could we still see those costs flatline or go higher before they start coming down on the new leaching?
Kathleen Quirk: Our objectives and our targets are that they'll come down. So we should -- you should see -- in 2025, you should see lower costs from what we had in 2024. Now that depends on moly and some other things but just site production costs you should see costs trending lower in 2025 from where they were in '24.
Operator: Our next question will come from the line of Daniel Major with UBS.
Daniel Major: The first one, just on the sort of M&A capital allocation. You've acquired some more stock in Cerro Verde, but as you mentioned, you need a willing seller. I guess two parts to the question. Assuming you can't buy any more stock in Cerro Verde going forward, should we expect Freeport share buybacks in Q4 and into Q1 of next year? That's the first part of the question.
Kathleen Quirk: Well, I was just going to say, Richard, we're following our framework for cash allocation for shareholder returns. And so we deploy 50% of cash flow to -- cash flow available after CapEx, excluding the discretionary items, of 50% to shareholder returns and 50% to organic growth. And so we do expect that share purchases, to the extent that we're generating cash above the current dividend levels, will be available for us in the future to continue to buy stock back. The Cerro Verde was opportunistic. If there are opportunities in the future to buy Cerro Verde stock, like we said, it's a very high quality asset and so that's really just an opportunistic purchase.
Richard Adkerson: We have ongoing discussions with our shareholders and there's obviously differences in views about dividends versus stock buybacks. But this is something we actively discuss with our Board at every meeting and we'll be making decisions. It's great to be in a position now to be able to have those discussions and we're well below our debt levels targets. So we'll be able to execute this policy that Kathleen just spoke with you about.
Daniel Major: And maybe a follow-up, if I could, just on bigger picture, M&A. You're obviously seeing larger scale transactions starting to become more prominent in the sector. Is this something that you see as an opportunity going forward before some of these larger assets potentially get kind of taken off the market?
Kathleen Quirk: We monitor market activity…
Richard Adkerson: I've said for a long time that M&A is coming in our industry and it certainly will. And we're engaged in observing what goes on, discussions with our bankers and with other companies to see what opportunities might arise. But M&A is not fundamental to our strategy. I mean, we are focused and have opportunities to grow values for our shareholders organically and that's our primary focus, but we'll be in the marketplace and prepare to respond to opportunities. I've always felt that the best M&A comes from opportunities as opposed to predetermined strategic moves.
Operator: Our next question comes from the line of Lawson Winder with Bank of America Securities.
Lawson Winder: Just wanted to ask about capital allocation, particularly with respect to the larger projects. So I'm thinking of Bagdad and thinking of El Abra and thinking as now Lone Star. Would it be fair to characterize your decision making as one where you would wait on a decision on Bagdad until you have the information on the study that you're now expecting at the end of next year for both El Abra and Lone Star?
Kathleen Quirk: Well, Bagdad is a project that we can execute in the near term. We do want to -- and we've got the information on El Abra. So we know the comparison between El Abra and Bagdad. For Lone Star, we need to get these studies done and that's why we're pushing to get the studies done next year, that will help us assess that. But Bagdad is something that can be executed in a three to four year horizon. Lone Star, Safford will take longer to evaluate. But yes, in a perfect world we would like to have and that's the beauty of Freeport in that we have -- we manage all of these assets. And so we can look at capital allocation as to where it makes the most sense, where it has the best impact, the best returns for us to evaluate projects next to each other. So that's a real advantage and we do that regularly to make sure we're allocating capital to the projects that make the most sense, not just to the projects that we can do. We want to invest our capital in the projects that drive the most value. There are other considerations in terms of time frames that can be executed within et cetera. But generally, that's our philosophy is to allocate capital to the most valuable projects within our portfolio to compare and contrast those. So we will have more information on Safford next year and look at that next to Bagdad. But we think that Bagdad will -- the project will benefit Bagdad long term. Again, we're talking about -- we've got an 80 year plus reserve life there. And so that is a place where we feel investments make sense. And that's part of what guides our investment decisions is where do we have the resource and in this case, an established operation that we can leverage from. But they're not mutually exclusive. We can do more than one project. And so our goal is to -- if we've got projects that create value and we can execute those efficiently, we want to advance those aggressively.
Lawson Winder: And then just my follow-up would be just thinking about 2025 CapEx. I mean, how would you handicap thinking about that? I mean should we be thinking about 2025 CapEx being sort of in line with 24 ex smelter or should we be thinking about the possibility of major CapEx commitment at some point in '25, that would be cash outflow next year?
Kathleen Quirk: At this point in time, we don't see a major change to '25 CapEx. We do have some investments in our discretionary bucket in '25 to advance Bagdad, to derisk Bagdad. We're making some investments in power infrastructure. We're making some investments in tailings work that we're doing that we'd have to do anyway longer term. So we do have some investments in Bagdad in 2025 to derisk the overall project. But I don't see, based on the projects we're talking about in terms of El Abra, Bagdad, Lone Star, I don't see significant CapEx above what we have in our 2025 plans. But we'll continue to review those. If there's opportunities for us to advance things and that makes sense, we'll certainly be open to it. But at this point in time, this is our best estimate of what capital will look like in 2025.
Operator: Our final question comes from the line of Bill Peterson with JP Morgan.
Bennett Moore: I wanted to start real quick, if you could provide any updates on some of your smaller and near term discretionary projects on Slide 23, namely increasing stacking at Lone Star, Atlantic Copper recycling and the improvements at the Grasberg mill?
Kathleen Quirk: Just for everyone else, what he's talking about is these are the discretionary projects that are included in our capital that generally are not maintenance related that actually have investment returns associated with them. The Lone Star oxide expansion is coming to an end. We're going to be completing that in the 2025 time frame. And so that will allow us to basically sustain 300 million pounds of copper per annum. Beyond that, Lone Star, we're talking about a major expansion and that is what we were talking about earlier studying. At Grasberg, we're installing a copper cleaner that will allow us to improve our concentrate grades and our metal recoveries. That investment is -- essentially, we've completed the major construction and we'll be installing that project, commissioning that project here in the fourth quarter. So that one is coming to an end, you won't see any significant cost for that one in 2025. The circular project at Atlantic Copper is taking advantage of Atlantic Copper's position in the market, the existing infrastructure. And we're developing a new circuit there to recycle e-scrap, electronic scrap material and that project is underway. It's expected to be in production next year, at the end of next year and it is going to add to Atlantic Copper. This may not be significant overall to Freeport, $60 million per annum, but it's significant to Atlantic Copper and particularly in the context of of low TCRCs. This allows Atlantic Copper to continue to generate business outside of copper and it's -- Atlantic is very well suited to do this kind of work and recycling the material that are in phones and other things that have value. So that project is in construction, and as I said, expect to be completed next year.
Bennett Moore: And then real quick, if I could just ask about the progress of the cleanup work going on at Grasberg, you've had success with placing this remote pumping equipment that you were speaking to last quarter?
Kathleen Quirk: We've made a lot of progress there. Things are -- continue to go very well at Grasberg. The team did well this quarter and actually exceeded the forecast, was able to get more tons through the mill than we had forecast and grades were strong. And so operations there are continuing to go very well.
Operator: And with that, I’ll turn the call back to management.
Kathleen Quirk: Thanks, Regina. Thank you, everyone, for all your good questions and participation. And we look forward to continue to keep you updated. And if you have any follow-ups, please contact David.
Operator: And that will conclude today's call. We thank you all for joining. You may now disconnect.
Subscribe now to gain full access to the earnings summary, 5 years analyst estimates and more exclusive content.
Subscribe NowWARNING: AI-generated summary.
While this is a phenomenal tool that can save you time and provide meaningful insights and key takeaways from the earnings call, it may contain inaccuracies or misinterpretations. For precise information, please refer to the original transcript.
(* All numbers are in thousands)

Fiscal Year | 2014 | 2015 | 2016 | 2017 | 2018 | 2019 | 2020 | 2021 | 2022 | 2023 |
---|---|---|---|---|---|---|---|---|---|---|
Revenue | 21,438,000 | 15,877,000 | 14,830,000 | 16,403,000 | 18,628,000 | 14,402,000 | 14,198,000 | 22,845,000 | 22,780,000 | 22,707,000 |
Cost Of Revenue | 19,504,000 | 28,524,000 | 17,580,000 | 12,022,000 | 13,445,000 | 13,105,000 | 11,655,000 | 14,030,000 | 15,089,000 | 15,826,000 |
Gross Profit | 1,934,000 | -12,647,000 | -2,750,000 | 4,381,000 | 5,183,000 | 1,297,000 | 2,543,000 | 8,815,000 | 7,691,000 | 6,881,000 |
Research And Development Expenses | 0 | 0 | 0 | 0 | 0 | 0 | 0 | 0 | 0 | 0 |
General And Administrative Expenses | 0 | 0 | 0 | 0 | 0 | 0 | 0 | 0 | 0 | 0 |
Selling And Marketing Expenses | 0 | 0 | 0 | 0 | 0 | 0 | 0 | 0 | 0 | 0 |
Selling General And Administrative Expenses | 592,000 | 569,000 | 607,000 | 484,000 | 443,000 | 414,000 | 370,000 | 383,000 | 420,000 | 479,000 |
Other Expenses | 36,000 | -86,000 | 49,000 | 49,000 | 76,000 | 209,000 | 209,000 | 146,000 | 236,000 | -319,000 |
Operating Expenses | 837,000 | 774,000 | 691,000 | 829,000 | 637,000 | 623,000 | 579,000 | 529,000 | 656,000 | 798,000 |
Cost And Expenses | 20,341,000 | 29,298,000 | 18,271,000 | 12,851,000 | 14,082,000 | 13,728,000 | 12,234,000 | 14,559,000 | 15,745,000 | 16,624,000 |
Interest Income | 0 | 0 | 0 | 0 | 0 | 542,000 | 563,000 | 559,000 | 419,000 | 0 |
Interest Expense | 630,000 | 645,000 | 755,000 | 801,000 | 945,000 | 620,000 | 598,000 | 602,000 | 560,000 | 782,000 |
Depreciation And Amortization | 3,863,000 | 3,497,000 | 2,530,000 | 1,714,000 | 1,754,000 | 1,412,000 | 1,528,000 | 1,998,000 | 2,019,000 | 2,068,000 |
EBITDA | 4,996,000 | -10,010,000 | -782,000 | 5,315,000 | 6,376,000 | 1,948,000 | 3,551,000 | 10,179,000 | 9,261,000 | 8,151,000 |
Operating Income | 97,000 | -13,382,000 | -2,792,000 | 3,633,000 | 4,754,000 | 536,000 | 2,437,000 | 8,366,000 | 7,037,000 | 6,083,000 |
Total Other Income Expenses Net | -891,000 | 45,000 | 724,000 | 151,000 | 291,000 | -230,000 | -640,000 | -707,000 | -322,000 | -77,000 |
income Before Tax | -424,000 | -14,021,000 | -3,472,000 | 2,902,000 | 3,892,000 | 306,000 | 1,797,000 | 7,659,000 | 6,715,000 | 6,006,000 |
Income Tax Expense | 324,000 | -1,935,000 | 371,000 | 883,000 | 1,374,000 | 510,000 | 944,000 | 2,299,000 | 2,267,000 | 2,270,000 |
Net Income | -1,268,000 | -12,195,000 | -4,315,000 | 1,817,000 | 2,257,000 | -204,000 | 853,000 | 4,306,000 | 3,468,000 | 1,848,000 |
Eps | -1.220 | -11.270 | -3.270 | 1.250 | 1.560 | -0.140 | 0.590 | 2.930 | 2.400 | 1.280 |
Eps Diluted | -1.220 | -11.270 | -3.270 | 1.250 | 1.550 | -0.140 | 0.580 | 2.900 | 2.390 | 1.280 |
Weighted Average Shares Outstanding | 1,038,686.131 | 1,082,000 | 1,317,905.405 | 1,447,000 | 1,449,000 | 1,451,000 | 1,453,000 | 1,466,000 | 1,441,000 | 1,434,000 |
Weighted Average Shares Outstanding Diluted | 1,039,000 | 1,082,000 | 1,318,000 | 1,454,000 | 1,458,000 | 1,451,000 | 1,461,000 | 1,482,000 | 1,451,000 | 1,443,000 |
Currency | USD | USD | USD | USD | USD | USD | USD | USD | USD | USD |
(* All numbers are in thousands)
Fiscal Year | 2014 | 2015 | 2016 | 2017 | 2018 | 2019 | 2020 | 2021 | 2022 | 2023 |
---|---|---|---|---|---|---|---|---|---|---|
Cash And Cash Equivalents | 464,000 | 224,000 | 4,245,000 | 4,447,000 | 4,217,000 | 2,020,000 | 3,657,000 | 8,068,000 | 8,146,000 | 5,666,000 |
Short Term Investments | 17,000 | 28,000 | 7,000 | 11,000 | 0 | 0 | 0 | 0 | 500,000 | 300,000 |
Cash And Short Term Investments | 464,000 | 224,000 | 4,245,000 | 4,447,000 | 4,217,000 | 2,020,000 | 3,657,000 | 8,068,000 | 8,146,000 | 5,966,000 |
Net Receivables | 2,296,000 | 2,277,000 | 2,094,000 | 1,571,000 | 1,322,000 | 1,167,000 | 1,412,000 | 1,742,000 | 1,795,000 | 1,664,000 |
Inventory | 5,361,000 | 4,788,000 | 3,642,000 | 3,893,000 | 4,759,000 | 3,958,000 | 3,893,000 | 4,497,000 | 5,180,000 | 6,060,000 |
Other Current Assets | 911,000 | 173,000 | 110,000 | 270,000 | 422,000 | 655,000 | 341,000 | 523,000 | 492,000 | 375,000 |
Total Current Assets | 9,032,000 | 7,462,000 | 10,435,000 | 10,779,000 | 10,720,000 | 7,800,000 | 9,303,000 | 14,830,000 | 15,613,000 | 14,065,000 |
Property Plant Equipment Net | 45,506,000 | 34,602,000 | 23,293,000 | 22,844,000 | 28,482,000 | 29,584,000 | 29,818,000 | 30,345,000 | 32,627,000 | 35,295,000 |
Goodwill | 0 | 1,000 | 0 | 0 | 0 | 0 | 0 | 0 | 0 | 0 |
Intangible Assets | 334,000 | 316,000 | 305,000 | 306,000 | 398,000 | 402,000 | 401,000 | 412,000 | 416,000 | 422,000 |
Goodwill And Intangible Assets | 334,000 | 317,000 | 305,000 | 306,000 | 398,000 | 402,000 | 401,000 | 412,000 | 416,000 | 422,000 |
Long Term Investments | 328,000 | 339,000 | 303,000 | 262,000 | 316,000 | 303,000 | 295,000 | 232,000 | 262,000 | 639,000 |
Tax Assets | 6,398,000 | 4,288,000 | 3,768,000 | 3,622,000 | 4,032,000 | -705,000 | -696,000 | -644,000 | 4,269,000 | 4,453,000 |
Other Non Current Assets | -2,803,000 | -431,000 | -787,000 | -511,000 | -1,260,000 | 3,425,000 | 3,023,000 | 2,847,000 | -2,094,000 | -2,368,000 |
Total Non Current Assets | 49,763,000 | 39,115,000 | 26,882,000 | 26,523,000 | 31,968,000 | 33,009,000 | 32,841,000 | 33,192,000 | 35,480,000 | 38,441,000 |
Other Assets | 0 | 0 | 0 | 0 | 0 | 0 | 0 | 0 | 0 | 0 |
Total Assets | 58,795,000 | 46,577,000 | 37,317,000 | 37,302,000 | 42,688,000 | 40,809,000 | 42,144,000 | 48,022,000 | 51,093,000 | 52,506,000 |
Account Payables | 3,653,000 | 3,355,000 | 2,393,000 | 2,321,000 | 2,625,000 | 2,576,000 | 2,708,000 | 3,495,000 | 4,027,000 | 2,466,000 |
Short Term Debt | 478,000 | 649,000 | 1,232,000 | 1,414,000 | 17,000 | 5,000 | 34,000 | 372,000 | 1,037,000 | 850,000 |
Tax Payables | 410,000 | 23,000 | 66,000 | 565,000 | 199,000 | 119,000 | 324,000 | 1,541,000 | 744,000 | 786,000 |
Deferred Revenue | 105,000 | 48,000 | 82,000 | 91,000 | 35,000 | 0 | 65,000 | 191,000 | 76,000 | 161,000 |
Other Current Liabilities | 967,000 | 255,000 | 558,000 | 1,212,000 | 642,000 | 628,000 | 610,000 | 1,834,000 | 1,205,000 | 2,338,000 |
Total Current Liabilities | 5,203,000 | 4,307,000 | 4,265,000 | 5,038,000 | 3,319,000 | 3,209,000 | 3,417,000 | 5,892,000 | 6,345,000 | 5,815,000 |
Long Term Debt | 18,492,000 | 19,779,000 | 14,795,000 | 11,703,000 | 11,124,000 | 9,821,000 | 9,677,000 | 9,078,000 | 9,583,000 | 8,656,000 |
Deferred Revenue Non Current | 3,628,000 | 3,739,000 | 3,487,000 | 3,631,000 | 3,653,000 | 3,630,000 | 3,705,000 | 4,116,000 | 0 | 347,000 |
Deferred Tax Liabilities Non Current | 6,386,000 | 4,288,000 | 3,768,000 | 3,622,000 | 4,869,000 | 4,210,000 | 4,408,000 | 4,234,000 | 4,269,000 | 4,453,000 |
Other Non Current Liabilities | 1,861,000 | 1,656,000 | 1,745,000 | 2,012,000 | 2,230,000 | 2,491,000 | 2,269,000 | 1,683,000 | 6,025,000 | 5,925,000 |
Total Non Current Liabilities | 30,367,000 | 29,462,000 | 23,795,000 | 20,968,000 | 21,876,000 | 20,152,000 | 20,059,000 | 19,111,000 | 19,877,000 | 19,381,000 |
Other Liabilities | 0 | 0 | 0 | 0 | 0 | 0 | 0 | 0 | 0 | 0 |
Capital Lease Obligations | 0 | 0 | 0 | 0 | 0 | 248,000 | 228,000 | 319,000 | 332,000 | 347,000 |
Total Liabilities | 35,570,000 | 33,769,000 | 28,060,000 | 26,006,000 | 25,195,000 | 23,361,000 | 23,476,000 | 25,003,000 | 26,222,000 | 25,196,000 |
Preferred Stock | 0 | 0 | 0 | 0 | 150,000 | 0 | 0 | 0 | 0 | 0 |
Common Stock | 117,000 | 137,000 | 157,000 | 158,000 | 158,000 | 158,000 | 159,000 | 160,000 | 161,000 | 162,000 |
Retained Earnings | 128,000 | -12,387,000 | -16,540,000 | -14,722,000 | -12,386,000 | -12,280,000 | -11,680,000 | -7,375,000 | -3,907,000 | -2,059,000 |
Accumulated Other Comprehensive Income Loss | -544,000 | -503,000 | -548,000 | -487,000 | -605,000 | -676,000 | -583,000 | -388,000 | -320,000 | -274,000 |
Other Total Stockholders Equity | 18,586,000 | 20,581,000 | 22,982,000 | 23,028,000 | 22,286,000 | 22,096,000 | 22,278,000 | 21,583,000 | 19,621,000 | 18,864,000 |
Total Stockholders Equity | 18,287,000 | 7,828,000 | 6,051,000 | 7,977,000 | 9,603,000 | 9,298,000 | 10,174,000 | 13,980,000 | 15,555,000 | 16,693,000 |
Total Equity | 23,225,000 | 12,808,000 | 9,257,000 | 11,296,000 | 17,493,000 | 17,448,000 | 18,668,000 | 23,019,000 | 24,871,000 | 27,310,000 |
Total Liabilities And Stockholders Equity | 58,795,000 | 46,577,000 | 37,317,000 | 37,302,000 | 42,688,000 | 40,809,000 | 42,144,000 | 48,022,000 | 51,093,000 | 52,506,000 |
Minority Interest | 4,938,000 | 4,980,000 | 3,206,000 | 3,319,000 | 7,890,000 | 8,150,000 | 8,494,000 | 9,039,000 | 9,316,000 | 10,617,000 |
Total Liabilities And Total Equity | 58,795,000 | 46,577,000 | 37,317,000 | 37,302,000 | 42,688,000 | 40,809,000 | 42,144,000 | 48,022,000 | 51,093,000 | 52,506,000 |
Total Investments | 328,000 | 339,000 | 303,000 | 262,000 | 316,000 | 303,000 | 295,000 | 232,000 | 262,000 | 939,000 |
Total Debt | 18,970,000 | 20,428,000 | 16,027,000 | 13,117,000 | 11,141,000 | 9,826,000 | 9,711,000 | 9,450,000 | 10,620,000 | 9,853,000 |
Net Debt | 18,506,000 | 20,204,000 | 11,782,000 | 8,670,000 | 6,924,000 | 7,806,000 | 6,054,000 | 1,382,000 | 2,474,000 | 4,187,000 |
Currency | USD | USD | USD | USD | USD | USD | USD | USD | USD | USD |
(* All numbers are in thousands)
Fiscal Year | 2014 | 2015 | 2016 | 2017 | 2018 | 2019 | 2020 | 2021 | 2022 | 2023 |
---|---|---|---|---|---|---|---|---|---|---|
Net Income | -745,000 | -12,089,000 | -3,827,000 | 2,038,000 | 2,526,000 | -192,000 | 865,000 | 5,365,000 | 4,479,000 | 1,842,000 |
Depreciation And Amortization | 8,023,000 | 16,771,000 | 6,421,000 | 1,732,000 | 1,754,000 | 1,170,000 | 1,224,000 | 1,922,000 | 2,019,000 | 2,068,000 |
Deferred Income Tax | -929,000 | -2,039,000 | 239,000 | -317,000 | -178,000 | 59,000 | 162,000 | -171,000 | 36,000 | 182,000 |
Stock Based Compensation | 106,000 | 85,000 | 86,000 | 71,000 | 76,000 | 63,000 | 99,000 | 98,000 | 95,000 | 109,000 |
Change In Working Capital | -865,000 | 161,000 | 67,000 | 813,000 | -460,000 | 349,000 | 665,000 | 755,000 | -1,528,000 | -880,000 |
Accounts Receivables | 215,000 | 813,000 | -175,000 | 427,000 | 649,000 | 119,000 | 132,000 | -472,000 | 56,000 | 166,000 |
Inventory | -249,000 | 379,000 | 117,000 | -393,000 | -631,000 | 259,000 | 42,000 | -618,000 | -573,000 | -873,000 |
Accounts Payables | -394,000 | -217,000 | -28,000 | 110,000 | -106,000 | -60,000 | 132,000 | 495,000 | -73,000 | -161,000 |
Other Working Capital | -437,000 | -814,000 | 153,000 | 669,000 | -372,000 | 31,000 | 359,000 | 1,350,000 | -938,000 | -12,000 |
Other Non Cash Items | 8,064,000 | 17,102,000 | 7,164,000 | 2,077,000 | 145,000 | 33,000 | 2,000 | -254,000 | 38,000 | 1,958,000 |
Net Cash Provided By Operating Activities | 5,631,000 | 3,220,000 | 3,729,000 | 4,682,000 | 3,863,000 | 1,482,000 | 3,017,000 | 7,715,000 | 5,139,000 | 5,279,000 |
Investments In Property Plant And Equipment | -7,215,000 | -6,353,000 | -2,813,000 | -1,410,000 | -2,068,000 | -2,652,000 | -1,961,000 | -2,115,000 | -3,469,000 | -4,824,000 |
Acquisitions Net | 283,000 | 0 | 3,660,000 | 0 | -3,043,000 | 452,000 | 706,000 | -33,000 | 189,000 | 50,000 |
Purchases Of Investments | 0 | 0 | 0 | 0 | 0 | 0 | 0 | 0 | 0 | 0 |
Sales Maturities Of Investments | 0 | 0 | 0 | 0 | 0 | 0 | 0 | 0 | 0 | 0 |
Other Investing Activites | -4,084,000 | -6,246,000 | -110,000 | -1,363,000 | 93,000 | 97,000 | -9,000 | 184,000 | -160,000 | -132,000 |
Net Cash Used For Investing Activites | -3,801,000 | -6,246,000 | 3,550,000 | -1,363,000 | -5,018,000 | -2,103,000 | -1,264,000 | -1,964,000 | -3,440,000 | -4,906,000 |
Debt Repayment | -10,306,000 | -6,677,000 | -3,944,000 | -3,812,000 | -2,717,000 | -3,197,000 | -3,724,000 | -1,461,000 | -1,220,000 | -1,209,000 |
Common Stock Issued | 0 | 1,936,000 | 1,515,000 | 0 | 3,500,000 | 8,000 | 17,000 | 1,411,000 | 125,000 | 47,000 |
Common Stock Repurchased | 0 | 8,272,000 | 0 | 0 | 632,000 | -8,000 | -17,000 | -488,000 | -1,402,000 | -50,000 |
Dividends Paid | -1,305,000 | -605,000 | -6,000 | -2,000 | -218,000 | -291,000 | -73,000 | -331,000 | -866,000 | -863,000 |
Other Financing Activites | 8,260,000 | 8,132,000 | 784,000 | 759,000 | -297,000 | 1,932,000 | 3,669,000 | -471,000 | -575,000 | -675,000 |
Net Cash Used Provided By Financing Activities | -3,351,000 | 2,786,000 | -3,166,000 | -3,055,000 | 900,000 | -1,556,000 | -128,000 | -1,340,000 | -1,623,000 | -2,700,000 |
Effect Of Forex Changes On Cash | 0 | 0 | 0 | 0 | 0 | 0 | 0 | 0 | 0 | 236,000 |
Net Change In Cash | -1,521,000 | -240,000 | 4,068,000 | 202,000 | -255,000 | -2,177,000 | 1,625,000 | 4,411,000 | 76,000 | -2,091,000 |
Cash At End Of Period | 464,000 | 224,000 | 4,245,000 | 4,447,000 | 4,455,000 | 2,278,000 | 3,903,000 | 8,314,000 | 8,390,000 | 5,666,000 |
Cash At Beginning Of Period | 1,985,000 | 464,000 | 177,000 | 4,245,000 | 4,710,000 | 4,455,000 | 2,278,000 | 3,903,000 | 8,314,000 | 7,757,000 |
Operating Cash Flow | 5,631,000 | 3,220,000 | 3,729,000 | 4,682,000 | 3,863,000 | 1,482,000 | 3,017,000 | 7,715,000 | 5,139,000 | 5,279,000 |
Capital Expenditure | -7,215,000 | -6,353,000 | -2,813,000 | -1,410,000 | -2,068,000 | -2,652,000 | -1,961,000 | -2,115,000 | -3,469,000 | -4,824,000 |
Free Cash Flow | -1,584,000 | -3,133,000 | 916,000 | 3,272,000 | 1,795,000 | -1,170,000 | 1,056,000 | 5,600,000 | 1,670,000 | 455,000 |
Currency | USD | USD | USD | USD | USD | USD | USD | USD | USD | USD |
(* All numbers are in thousands)
Revenue (TTM) : | 22.707B | P/S (TTM) : | 2.26 | |
Net Income (TTM) : | 1.842B | P/E (TTM) : | 28.88 | |
Enterprise Value (TTM) : | 62.199B | EV/FCF (TTM) : | 29.44 | |
Dividend Yield (TTM) : | 0.01 | Payout Ratio (TTM) : | 0.43 | |
ROE (TTM) : | 0.12 | ROIC (TTM) : | 0.09 | |
SG&A/Revenue (TTM) : | 0 | R&D/Revenue (TTM) : | 0 | |
Net Debt (TTM) : | 3.562B | Debt/Equity (TTM) | 0.55 | P/B (TTM) : | 3.3 | Current Ratio (TTM) : | 2.33 |
Trading Metrics:
Open: | 40.09 | Previous Close: | 40.03 | |
Day Low: | 39.87 | Day High: | 40.81 | |
Year Low: | 36.26 | Year High: | 55.24 | |
Price Avg 50: | 41.93 | Price Avg 200: | 46.33 | |
Volume: | 10.02M | Average Volume: | 11.221M |