EXPD
Expeditors International of Washington, Inc.
$146.5
5.94
(4.23%)
| Exchange: | |
| Market Cap: | 19.883B |
| Shares Outstanding: | 144.704M |
About The Company
| Sector: | Industrials | |||||
| Industry: | Integrated Freight & Logistics | |||||
| CEO: | Daniel R. Wall | |||||
| Full Time Employees: | 19203 | |||||
| Address: |
|
|||||
| Website: | https://www.expeditors.com |
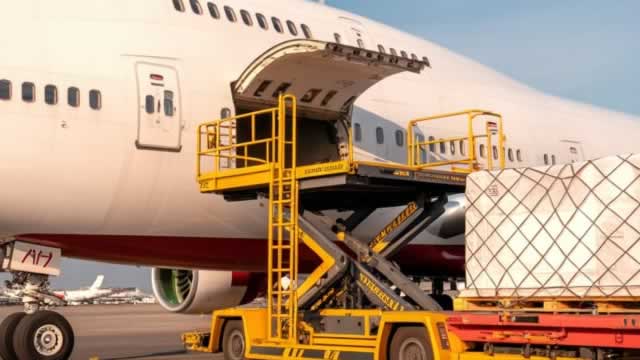
Expeditors International of Washington, Inc. provides logistics services in the Americas, North Asia, South Asia, Europe, the Middle East, Africa, and India. The company offers airfreight services, such as air freight consolidation and forwarding; ocean freight and ocean services, including ocean freight consolidation, direct ocean forwarding, and order management; customs brokerage, intra-continental ground transportation and delivery, and warehousing and distribution services; and customs clearance, purchase order management, vendor consolidation, time-definite transportation services, temperature-controlled transit, cargo insurance, specialized cargo monitoring and tracking, and other supply chain solutions. It also provides optimization, trade compliance, consulting, cargo security, and solutions. In addition, it acts as a freight consolidator or as an agent for the airline, which carries the shipment. Further, the company provides ancillary services that include preparation of shipping and customs documentation, packing, crating, insurance services, negotiation of letters of credit, and the preparation of documentation to comply with local export laws. Its customers include retailing and wholesaling, electronics, technology, and industrial and manufacturing companies. Expeditors International of Washington, Inc. was incorporated in 1979 and is headquartered in Seattle, Washington.
Click to read more…
Revenue Segmentation
EPS
Earnings Call
Income Statement
(* All numbers are in thousands)
Balance Sheet
(* All numbers are in thousands)
Cash Flow Statement
(* All numbers are in thousands)
Analyst Estimates
(* All numbers are in thousands)


