Exchange: | NYSE |
Market Cap: | 3.832B |
Shares Outstanding: | 181.024M |
Sector: | Technology | |||||
Industry: | Information Technology Services | |||||
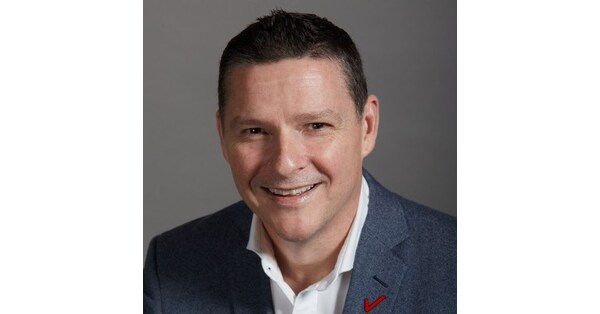
CEO: | Mr. Raul J. Fernandez | |||||
Full Time Employees: | 130000 | |||||
Address: |
|
|||||
Website: | https://www.dxc.technology |
Click to read more…
Operator: Hello, and welcome to the DXC Technology Q4 Earnings Call. [Operator Instructions] I would now like to turn the conference over to John Sweeney, Vice President, Investor Relations. You may begin.
John Sweeney: Thank you, and good afternoon, everybody. I'm pleased that you're joining us for the DXC Technology's fourth quarter fiscal year 2024 earnings call. Our speakers on the call today will be Raul Fernandez, President and CEO; and Rob Del Bene, our EVP and CFO. The call is being webcast at DXC Investor Relations website, and the webcast includes slides that will accompany this discussion today. Today's presentation includes certain non-GAAP financial measures, which we believe provide useful information to our investors. In accordance with SEC rules, we provide a reconciliation of these measures to their respective and most directly comparable GAAP measures. These reconciliations can be found in the tables included in today's earnings release and in the webcast slides. Certain comments we make on the call will be forward-looking. These statements are subject to known risks and uncertainties, which could cause actual results to differ materially from those expressed on the call. A discussion of these risks and uncertainties is included in our Annual Report on Form 10-K and other SEC filings. I'd now like to remind our listeners that DXC Technology assumes no obligation to update the information presented on the call except as required by law. And with that, I'd like to introduce DXC's President and CEO, Raul Fernandez. Raul?
Raul Fernandez: Thank you. I will give a brief introduction, review our financial performance, update you on the progress we are making with our offerings. Then Rob will take us through the fourth quarter financial results and discuss our fiscal year 2015 guidance. I will also make some final remarks before opening the call up for questions. In Q4 of fiscal year 2024, total revenue declined 5% on a constant currency basis, above our expectation. Adjusted EBIT margin of 8.4%, down 50 basis points year-over-year. Non-GAAP EPS of $0.97 was also above our guidance range. Free cash flow equaled $155 million for a total of $756 million for the full year. This is the third consecutive year that DXC has achieved free cash flow of more than $700 million. While we met or beat expectations in Q4, and we know we can operate at a higher level and are not satisfied with the current state. In my five-month tenure, I have met with more than three dozen customers globally, along with thousands of our employees in small and large settings, in-person and virtual. I have engaged with dozens of investors and have successfully recruited very strong, experienced executives to join our team. I believe we have a global team that is reenergized to make the company better and more effective. I've also gotten a deeper understanding of all of our business units. So let me quickly recap a few thoughts, starting with insurance. DXC is the largest provider of insurance software and insurance business process services globally from origination to claims processing. We are the category leader providing software and services in three out of four insurance segments: Life & Wealth, Global Specialty and Reinsurance. As an example, our technology and services process one in five property and casualty transactions worldwide. Our global customer base includes 21 of the top 25 global insurance carriers. In short, we are a key strategic technology partner, supporting global insurance companies with their customers, their agents and their employees. The strong recurring and reoccurring revenue, coupled with 90-plus percent customer retention and an average customer tenure of 18 years makes this a very interesting business unit for me to focus on. As Rob will comment, the insurance software and services business representing approximately three-fourth of the total insurance revenue grew at a very respectable 4.5% in the quarter. It's an incredibly strong foundation to build on and continue to grow and also to rotate our revenue mix more towards SaaS and reoccurring services. So we are actively working on a focused plan to further accelerate the growth of this business unit and also highlight the value of its leadership role in the industry and its mix of software and reoccurring services. Continuing with GBS, we're bringing together the best capabilities of our analytics and engineering and applications business now called consulting and engineering services with industry veteran Howard Boville, as our General Manager. Our consulting and engineering services business has a rich and extensive history of driving transformative change for some of the world's biggest brands. In financial services, we provide core banking solutions to numerous banks globally. Within automotive and manufacturing, we are deeply involved in their digital transformation. We enable major auto brands to operate their research and development efforts for autonomous driving on our platform, enabling the ingestion and analysis of large data sets. We have built and run in-car infotainment systems across most of the luxury brands. While our technology solutions and operations are critical for our customers, our execution is below average, and we are focused on improving the profitability of our consulting and engineering services business unit. Moving on to security. A key thing to note about our security business is that it is an enabler of many of our other services. Customers in our ITO and modern workplace rely on us to provide services in a secure, resilient way. Our security teams embed themselves in those offerings to do that in cooperation with our clients. We have over 3,000 security professionals operating across eight global security operations centers where we provide a round-the-clock coverage for our customers. As cyber threats increased by the day, not a week goes by that our teams are not called in to assist companies dealing with a security incident. The pace and complexity of these attacks are growing as the regulatory requirements for companies dealing with them. Our focus in the security business is to continue to leverage our expertise to enhance our GBS and GIS offerings while also focusing on accelerating growth of our standalone services. With the recent addition of several industry veterans, we expect to enable that growth. Moving on to cloud and ITO. For our cloud and ITO offering, we provide business and mission critical services for some of the world's most essential workloads. As I have spent time in the business, I meet more and more customers who reiterate how critical our work is. Many of the world's largest airlines, energy companies, financial institutions, along with government organizations, count on DXC for the systems at the heart of their business. Our teams around the globe work 24/7 to keep their operations running seamlessly and securely. This is a core competency of the company. We operate across the entire technology domain, from legacy core mainframes all the way through the most cutting-edge serverless cloud environments on AWS, Azure, and Google Cloud. As our customers modernize their estates, moving on to more cloud and modern architecture, often with the help of our GBS business unit, we are well positioned to help them securely operate across multiple environments. This is the foundation we are building on as we pivot our focus in this business to high quality, profitable, cash generating service revenue and away from the heavy hardware, software, and data center outsourcing style deals of the past, withdraw higher revenue at the expense of profit. Continuing with modern workplace, we support over 7 million devices and employees all day, every day. The employee experience is more mission critical than ever. Today, we operate services with a combination of human and non-human workforce globally and at scale. Driven by AI, we believe we will reach a point soon where at least 75% of our workforce capacity is non-human. We are building and demonstrating expertise in how to manage the non-human workforce at this scale. In dialogue across our customer base, the message is clear. Embracing AI technology is a central part of their digital strategy going forward, and we are well positioned to lead this. As I mentioned before, and it's even more clear to me now, there were missed opportunities in the past to rationalize systems, processes, legal entities, go-to-market, and delivery functions. Therefore, to strengthen our market position, we are undertaking a restructuring initiative aimed at simplifying and enhancing our operational efficiency. We will simplify our processes, increase visibility to eliminate redundancies, reduce costs, improve resource management, and ultimately drive a more streamlined, agile, and competitive organization. One specific example of this enterprise initiative is consolidating our five acquired enterprise business systems, and optimizing our back-end office functions. We anticipate not only a material reduction in our operating costs, but also improvements in our service delivery and responsiveness to our customers. We are also aligning our organizational structure to support streamlined operations with improved and faster decision making. This realignment will make us more competitive. Now, Rob will walk you through the financials.
Rob Del Bene: Thank you, Raul, and good afternoon everyone, and thanks for joining our call. Today, I'll review our fourth quarter financial results and then provide you with our outlook for the full year and for the first quarter of fiscal 2025. Total organic revenue growth declined 4.9% year-to-year, ahead of our fourth quarter guidance. GBS revenue was nearly flat, while GIS top line declined 9.3%. Adjusted EBIT margin was 8.4%, above the top end of our guidance, representing an 80 basis point improvement sequentially, driven by our cost reduction initiatives. Margin was down 50 basis points year-to-year, primarily driven by lower non-cash pension income and the impact of gains from asset sales booked in the fourth quarter of fiscal 2023. Non-GAAP EPS was $0.97, down $0.05 from last year's fourth quarter. The year-to-year change was driven by a negative $0.13 adjusted EBIT impact, higher taxes of $0.08 and the non-controlling interest impact of $0.03. These reductions were partially offset by a $0.19 benefit from our share repurchase program. Free cash flow, defined as operating cash flow less CapEx, for the quarter equaled $155 million compared to our expectation of about $200 million. The shortfall was due to a combination of a smaller benefit from working capital and higher than anticipated cash tax levels. For the year, our free cash flow totaled $756 million, which was the third straight year above $700 million, demonstrating consistency of cash generation performance. And now, I'll turn to our fourth quarter key financial metrics. Gross margin equaled 23.6%, flat year-to-year as we continue to drive workforce optimization and reduce our real estate footprint in the face of declining revenue. SG&A was 8.7% of revenue, down 70 basis points year-to-year, largely driven by ongoing spending management and a $10 million non-recurring insurance reimbursement. Depreciation and amortization was flat year-to-year as a percent of revenue, down $17 million, reflecting continued capital discipline. Other income for the quarter was $39 million, a year-to-year reduction of $48 million, which is a 120 basis point impact to EBIT margin, driven by lower pension income of $26 million and lower gains on asset sales of $19 million. Now, turning to our segment results. For GBS, organic revenue performance was nearly flat year-to-year with the deceleration largely driven by the ongoing challenging market environment for analytics and engineering and applications. GBS profit margin equaled 13.3%, down 40 basis points year-to-year, but up 140 basis points sequentially, primarily driven by a more favorable mix of higher-margin services revenue. For GIS, organic revenue declined 9.3%, largely consistent with our performance throughout the year. We have taken a very disciplined financial approach with new deals and renewals and this has been reflected in our bookings and revenue performance of both Cloud and ITO and modern workplace. GIS margins declined 40 basis points year-to-year with operational improvements more than offset by a lower level of pension income. Let me now provide some detail on our individual offerings, first in GBS. Both Analytics and Engineering and Applications organic revenue declined 1% year-to-year as performance continues to be impacted by the current challenging market environment. While the revenue decline the book-to-bill ratios for these two businesses were 1.0 or better with strong renewal activity that does not provide incremental short-term revenue, but provides longer-term revenue stability. Insurance organic revenue increased 1% year-to-year. Embedded in this performance is our insurance software and services business, which represents approximately three-fourth of the total that continued its strong momentum, up 4.5% in the quarter, normalizing for significant large perpetual license sale in the fourth quarter of last year, the insurance software and services business grew approximately 9% year-to-year. The insurance book-to-bill was 0.8x. As a reminder, bookings in this business can vary significantly quarter-to-quarter based on the timing of large renewals. For example, last quarter, we had two significant renewals book-to-bill was 1.58. Now moving to our GIS segment. Security declined 9% year-over-year on an organic basis with a book-to-bill ratio of 0.96. Cloud infrastructure and IT outsourcing organic revenue declined 7% an improvement from double-digit declines we saw in the prior three quarters due to significant resale transaction delivered in the quarter. The book-to-bill was 0.75x result of the ongoing challenging ITO market and our selective approach to new deals. Modern Workplace organic revenue declined year-to-year in the mid-teens impacted by resale revenue, which was down 30%. Book-to-bill performance this quarter was a strong 1.29x due to several large renewals. Now turning to our financial foundation. We sequentially reduced our total debt levels by $450 million. And for the full year, our total debt levels have been reduced by $300 million. Net interest expense for the quarter was $20 million up $3 million year-to-year, reflecting the higher interest rate environment on our short-term borrowings. Restructuring and TSI expense was $21 million and for the full year, it was $118 million, about half of the level spent in fiscal 2023. Operating lease payments of $84 million were down $9 million year-to-year due to the management of our real estate footprint. The fourth quarter capital expenditures were $125 million and lease originations were $21 million. Our finance lease and asset financing payments continued to trend down and as a percentage of revenue, capital expenditures and lease originations declined to 4.3%, down more than a point year-over-year, representing a multiyear level. Turning to capital deployment. As I mentioned, in the fourth quarter, we deployed approximately $450 million of cash to reduce our debt levels. We accomplished this by retiring our outstanding balance of commercial paper and continuing to decrease our lease portfolio. We returned $138 million of capital to shareholders, repurchasing 6.2 million shares at a weighted average price per share of $22.30. For the full year, we repurchased over 18% of our shares outstanding at a total cost of $883 million. Since the beginning of the fiscal year 2022, we have reduced our share count by more than 30%. As we enter a new fiscal year, I would like to provide clarity on our updated financial priorities. Our plan is to deploy our capital to accomplish two things. First, given our recent revenue performance, we will execute a restructuring program to address excess capacity largely concentrated in GIS and right-size our infrastructure throughout the company to improve profitability. The second priority is to further reduce debt levels, including significantly minimizing finance lease originations. Now turning to our full year 2025 guidance. We expect our total organic revenue to decline 4% to 6%. In GBS, we expect our full year outlook to be slightly positive with the first half performance in line with our fourth quarter of fiscal 2024 and with a return to growth in the second half of the year. In GIS, given last year's bookings and the resulting impact to opening backlog combined with continued expected lower resale revenue and deal selectivity in fiscal 2025, we anticipate full year organic revenue to decline in the low double-digit range. Our guidance for adjusted EBIT margin is 6% to 7%. This guidance primarily reflects the impact from lower year-to-year revenue and investments we're making in the business to drive productivity improvements. Additionally, we will be executing on the previously mentioned restructuring action to improve margins on a sustainable basis going forward with the impact of the savings largely materializing in late fiscal 2025 and into fiscal 2026. As I've mentioned on previous calls, we continue to rationalize our real estate portfolio. These potential sales will provide a cash inflow outside of free cash flow, but will have a negative impact on our adjusted EBIT margin. The potential loss on these sales is not included in the guidance as the market remains difficult and the timing is uncertain. And with this expected adjusted EBIT margin levels, our full year non-GAAP diluted EPS guidance is $2.50 to $3 and with an assumed non-GAAP effective tax rate of 30%. Our free cash flow guidance for fiscal 2025 is about $400 million. There are two main drivers contributing to the lower year-over-year level and without these changes, free cash flow would be at levels consistent with fiscal 2024 performance. As I previously mentioned, we will be reducing our debt levels in fiscal 2025, and a component of our debt reduction strategy is significantly reducing finance lease originations and which were $185 million in fiscal 2024. This change in funding approach will reduce our overall debt levels but will increase our capital expenditures impacting free cash flow. Also impacting free cash flow will be spending related to the increased level of restructuring, which will be an increase of approximately $250 million year-to-year. Our expectation is that the restructuring savings will put us on a sustainable path of free cash flow generation above fiscal 2024 levels in fiscal 2026. As a reminder, our Q1 free cash flow is seasonally lowest primarily due to the timing of bonus payouts and certain annual supplier payments. Consistent with prior years, cash flow generation will be strongest in the second half of the year. And now our first quarter outlook. In GBS we anticipate that revenue performance in A&E applications will continue to reflect the current challenging market environment. In GIS, services revenue will decline in the mid- to high single-digit range with resale taking the GIS decline to double digits. With these factors, we expect total company organic revenue to decline 7% to 8%. We anticipate adjusted EBIT margins in the range of 5.5% to 6%, a function of the lower revenue and first quarter seasonality, which has consistently impacted our results in prior years. And finally, non-GAAP diluted EPS of $0.55 to $0.60. With that, let me turn the call back over to Raul for key takeaways.
Raul Fernandez: Thank you, Rob. There is quite a lot to do to operate at a higher level. That's why I'm so happy with the additions to our executive team in the last 60 days. They are all industry veterans with proven track records. We will define success by continuing to perform better every quarter, while we transform as quickly as possible. Thank you for attending the call. Operator, we're going to open it up for questions.
Operator: Thank you. [Operator Instructions] Your first question comes from the line of Bryan Keane with Deutsche Bank. Your line is open.
Bryan Keane: Hi, guys. Thanks for taking the question. Raul, maybe you could just help us understand how your restructuring might be different than many of the CEOs that came before you that had a lot of restructuring as well. It seems like every 5 years or so, a CEO comes in, looks at the business and restructures it. Just trying to get a sense of how maybe your plans might look different than what we've seen over the last few decades at CSC and now DXC?
Raul Fernandez: Yes. Okay, great question. Thank you. I know that as you've mentioned, in the short history of this public company, there have been previous restructurings. But as someone who just got here and have really spent a lot of time operationally looking at our systems, our processes, our entities, our distribution of headcount, it's clear to me that the previous restructurings did not set a real, clean, solid, fully integrated baseline for profitable growth. You can look at that in multiple ways. Number of systems still in place that were acquired over time, never integrated, never deduped. Number of business processes that got stacked on top of each other. Number of legal entities. I think anyone that came in would look at the previous work. And again, I know the history is there so I'm not running away from it. But I can tell you that this is a real reset. It is bottoms up. It is a strong foundation to go from and it is absolutely needed because otherwise, we just continue to carry a really not fully functional organization that can take advantage of the opportunities that we have.
Bryan Keane: Got it. And then just as a follow-up, are any of the restructuring charges, are those going to be -- are those through the P&L so they're in the margin targets that we're looking at or are those outside those targets? And then secondly to that, just on GBS, a little bit of a recovery I think you talked about in the second half of the year. What gives you confidence in that GBS recovery for positive organic growth in the second half? Thanks.
Robert Del Bene: Yes, Bryan. This is Rob Del Bene. Thanks for the question. First on restructuring. Restructuring is not included. Consistent with the approach taken since the beginning of the company, restructuring is not included in the adjusted EBIT margin. It obviously is included in the free cash flow numbers. So, that's the answer to your first question. On the GBS first half to second half dynamic, with a difficult marketplace, we do see the first half of the year performance similar to the back half of fiscal 2024. We have some encouragement. Our pipelines have been improving, and our conversion rates are consistent. So, with that improved pipeline and conversion rates, we see us going from low single-digit negatives to low single-digit positives in the second half of the year.
Raul Fernandez: And it's all built on, again, new leadership there, new life cycle management in terms of opportunities. So, preproposal, proposal, pitching smarter, better, faster, and also eliminating frankly, some self-inflicted delivery issues that we have had, and in some cases, we're still working our way out of. As I've mentioned before, this isn't one lever. This is a lot of little levers. And I think one of the things that has given me additional encouragement that I'm looking at it correctly and the team is looking at it correctly is that as we've brought on great new experienced executives from great companies that have been succeeding in the marketplace all over the world, they have confirmed that it's a very opportunity-rich environment, meaning we have a lot of things that we can be doing better. And if we do those things better, again, not rocket science, operational excellence, and I'd say in some cases, just getting the average, that will show up top line and bottom-line and conversion and show up in gross margins, net margins, et cetera. So, I feel like we've got a way to go to get to a base and then we -- from that base, we're going to continue to grow off of it. But I think we've got the right people, the right structure and now the right go-to-market model and incentives, and I'm encouraged.
RobDel Bene: Great. I'll pass the line. Thanks.
Operator: Your next question comes from the line of Tien-Tsin Huang of JPMorgan. Your line is open.
Tien-Tsin Huang: Thanks so much. I'm just curious on the bookings side, how that came in versus plan in a little bit more detail and what we might expect as the fiscal year plays out here in terms of replenish either new logo or renewal?
RobDel Bene: Yes. So, Tien-Tsin, thanks. So, the bookings relative to the last forecast we gave 90 days ago were pretty consistent and actually a little better in GBS. And that was really, really due to renewals in A&E were strong and it's the second quarter in a row they've been strong. And in my remarks, I mentioned that those renewals, they don't translate into revenue growth in the first half of the year, but they do produce -- they provide rather a solid foundation for the second half. So that's -- so we did a little better than anticipated. We did as expected in GIS. And we -- going into fiscal 2025, we expect a very Similar picture where we have strong renewal activity in both GBS and GIS and then new content, and based on the pipeline, new content in GBS filtering in throughout and improving throughout the year in fiscal 2025.
Tien-Tsin Huang: Perfect. Thank you for that. And then maybe, Raul, just quickly, my quick follow-up, just with the additions to the management team. I know you're bringing some people in from familiar places. Are you done with some of the additions? Do you expect some other turnover or maybe new roles that should expand into the management team? Just curious what your thinking is there? Thank you.
Raul Fernandez: Yes. And look, you've seen some of the releases, right? So we've obviously announced some publicly, and then there are others that we didn't announce but they've joined the team across the organization. I've had the pleasure of working with a lot of great executives over my 25-plus years in technology. And in that journey, we've had the opportunity to work together and many of the executives that have come here, we've had the opportunity to compete together, work together and win together. So yes, we got a few more that are coming. But in terms of looking at the people that we need to execute, building on top of the team that's here, the great team that's here and adding some great executives that are fit for the roles where we need an additional horsepower, I feel like I've gotten the team 90-plus percent in place.
Tien-Tsin Huang: Okay. Good to know. Thank you.
Operator: Your next question comes from the line of Bryan Bergin with TD Cowen. Your line is open.
Bryan Bergin: Hi, guys. Good afternoon. Thank you. First question just on free cash flow. So understanding you have, I believe, the $250 million restructuring headwind that seems to be the biggest chunk in the year-over-year bridge. But can you talk about otherwise maybe the levers for free cash flow sustainability amid ongoing top line and potentially margin pressure? And can you also talk about maybe the annual outflows associated with capital lease payments going forward, too, after free cash flow?
RobDel Bene: Yes. So in terms of free cash flow, we start from a base of strength three years in a row, over $700 million, $750 million in fiscal 2024. And we have that solid base moving into fiscal 2025. And as I mentioned, the two impacts to that number are the increase in restructuring of $250 million and then the curtailment or significantly curtailing new lease originations, which does shift the spend over to CapEx impacting our free cash flow number in the year. Now we do have operating leverage here with or leverage with working capital. So there is room for improvement in working capital. We're going to be taking advantage of that in fiscal 2025 and beyond. And again, with the purpose of the restructuring is to shore up EBIT moving forward 2025 into fiscal 2026 and curtail that headwind that we faced for the last couple of years. So that's the plan. In terms of cap lease payments, we're in the low 200 range to 100 range and then down from there.
John Sweeney: And just to foot-stomp this, the lease originations will go from $185 million in FY 2024 to zero in 2025.
RobDel Bene: So a very small number.
John Sweeney: And that's a $185 million reduction in the free cash.
RobDel Bene: Yes. Thank you, John.
Bryan Bergin: Okay, okay. That's very helpful. Okay. And I guess a follow-up. Just as we think about the top line, the 2025 guide, as we try to unpack some of the factors you considered here as it relates to kind of revenue retention and whether you're also working to actively prune out any unfavorable basis of business contracts, any pieces of business you're looking at and assessing that's not strategic to the company? Anything that working through kind of here to be mindful of as you build the outlook?
Raul Fernandez: Yes, especially in ITO and Modern Workplace, where historically, there's been the packaging of less-than-optimal profitable reselling of products, reselling of software. That guidance or that direction changed when I got here, and we are going to have profitable contracts, profitable relationships. To the extent we don't have them right now, as we get into renewals of contracts, we're going to address that and then put them on the right footing. But the mandate is clear now that this isn't growth, growth at all costs, growth at a loss. This is growth with real profitability and a real foundation.
RobDel Bene: Yes. And Bryan, just piggybacking on that, we've incorporated that selectivity into our guide on revenue, so that's included, along with continued reduction of low-margin resale. All of that is packed into the GIS element of the guide.
Bryan Bergin: Okay. If I missed it, I apologize. Did you quantify that piece just so we can kind of parse that out?
RobDel Bene: Didn't quantify specifically the various elements. But in the -- in my opening remarks, I mentioned that we'll be high negative single-digits in GIS. And with the resale, it will be negative double-digits, low double-digits.
Bryan Bergin: Okay. Thank you very much.
RobDel Bene: Thank you.
Operator: Your next question comes from the line of Darrin Peller with Wolfe Research. Your line is open.
Paul Obrecht: Hi, thanks. This is Paul Obrecht on for Darrin. Can you just provide some color on what you're seeing in the broader macro environment and client behavior and maybe how that relates to three months ago? And as you built your fiscal year 2025 outlook, were you assuming any improvement in the broader demand as we go through the year?
Raul Fernandez: Sure. Look, I think there are a couple of factors, right, with companies that are operating at different levels of efficiency. And I think our issue is being more effective across the whole life cycle of capturing business, new business, solutioning it correctly, pricing it correctly, as well as on our existing business, obviously winning the recompetes and being able to create the right economic model for those recompetes. We have plenty of opportunity in the universe that we operate in. I think from a macro standpoint, I echo what others have said in the space that some discretionary spending is paused and has lightened up. I do think that, that is less of a headwind for us than optimizing our go-to-market and sales functions and getting those better. We can do -- we have our destiny in our hands by being better against the opportunities that we get to compete on, and that will be a bigger factor for us in the near term than the general macro environment.
Paul Obrecht: Got it. That's helpful. And then as a follow-up, you mentioned in Modern Workplace, you could see or you'll reach a point where 75% of the workforce is nonhuman. Can you just touch on the path to get there and what you're doing right now in the business to improve efficiency?
Raul Fernandez: Sure. If you think about a lot of the work there, it's a lot of resolution, small resolution of items across multiple people, humans, devices, countries, companies, et cetera. If you look at the focus of AI, specifically Copilot and the ability for agents to use large language models, small language models, real precise models to really proactively and interactively answer and deal with questions, that's the shift where we're going to be using AI in a manner where we can handle the workload, same or more, with a greater infusion of technology and not relying on an increase of humans or people for that. As we transition that, you'll go from a ratio of roughly 40% to 70-plus percent and that's the reference that I made there. But that's real. That's happening. It's actionable. We're experimenting with it across multiple accounts. And the other piece of good news is that the speed of compute behind AI is doubling every six months. So the speed, accuracy, and multimodal ability for a virtual agent to really be a great partner in delivering these services at a high quality is there today and getting better, and we're going to take full advantage of it.
Paul Obrecht: Great. Thank you.
Operator: Your next question comes from the line of Jonathan Lee with Guggenheim Securities. Your line is open.
Jonathan Lee: Great. Thanks for taking my question. Appreciate the level of detail here. You talked about working through some of the resale dynamics to help profitability. Can you help us understand any other levers you have across contract profitability, whether that's pricing or delivery?
RobDel Bene: Yes. So Jonathan, there's -- I think there's leverage across the board, in particular, in the ITO business. I'll just take that first. We've been on a march to reduce physical capacity with the revenue reductions we've experienced, and we will continue that this year as well. And the $100 million of restructuring between the $250 million year-to-year growth and the base of $350 million, that $100 million is predominantly on physical capacity. So that's one element that will deliver savings into the future. The second element is just efficiency and infrastructure at the account level, and we are going after that with the restructuring funding. So while we're very good at our service delivery levels, we've got high NPS scores, our restructuring is designed to eliminate the overhead within the accounts as opposed to the direct delivery population that we have. And we're firmly on that track and that's how we're going to execute the restructuring. In the GBS business, we have room to improve margins. And specifically, in the Consulting and Engineering business, our margins are below competition, and again, the restructuring is designed to help us narrow that gap to competition in that business unit. That's another lever for us.
Jonathan Lee: Great. Thanks for that. And just as a follow-up. As you think about the realignment of the company on a business unit basis versus geographic prior, can you talk about some of the client receptivity there?
Raul Fernandez: Yes. It is really the intersection, right? Because it's the intersection of the talent, the managers of delivery at the geography in tight coordination with the offering. And so what you're getting just from the beginning of the life cycle is better pre-bid solutioning, better solutioning, better deployment once you win. One of the things that companies can trip themselves upon, and we certainly have, is not being timely in the staffing or fully staffing of something that's won. That leads to SLAs. That's completely self-inflicted, 100% avoidable. If you plan better, you execute better. So that's another example of seeing a lot of little things that other organizations can do and I know we can do better that can have an impact. And that impact will be every month, every quarter, and we'll see that. So those are just some of the elements that I think our new go-to-market really resonates with, both the local geography, engaging the offering at a global level and ultimately, the most important thing, which is the customer. And in my several dozen conversations in the last 150 days, in talking through why we think this is a better way of serving our customers, it's been very receptive and very engaging with our customers.
Jonathan Lee: Appreciate that. Thank you.
Operator: Your next question comes from the line of Spencer Anson with Susquehanna. Your line is open.
Spencer Anson: Great. Thanks for taking my question. Raul, you had some relationship callouts on the insurance business. Can you just speak to any broader strategic or even tactical opportunities you see there with the insurance business? Thanks.
Raul Fernandez: Great. Yes. As I looked at every business unit, I think very early on, it became clear to me that we have an outsized opportunity in terms of a return on effort with our insurance business unit. With that opportunity in hand, we're exploring a small select and experienced group of partners that could help us accelerate growth with a good SaaS and reoccurring services mix while maintaining control of that business unit. So we're in that process right now. It's a great foundation. It's a great set of customers, a great history with those customers and really a critical partnership across the world in every aspect of supporting the different product lines that our customers bring to the marketplace.
Spencer Anson: Great. Thank you. appreciate it.
Operator: Your next question comes from the line of James Faucette with Morgan Stanley. Your line is open.
James Faucette: Thank you very much. I wanted to ask about go-to-market and sales process. I know, Raul in past conversations, you talked a lot about improving and tightening up the message to customers so that they understand the value that DXC can deliver, et cetera. And it sounds like with some of the changes that you've made, that the pipeline is expanding, but conversion rates are pretty stable. And it sounds like that's kind of the assumption for right now. But like how should we think about the process and the time to start to even improve conversion rates and how that may be helpful to getting the business back to growth?
Raul Fernandez: Yes. I think it's a function of the fundamentals, right? The fundamentals that we're operating under in ITO and Modern Workplace. The new leadership and the focus on key vertical solutions, replicability in Consulting and Engineering Services. And also in talking to customers, I always -- if it's an ITO customer or a Modern Workplace, I always come prepared to discuss something relevant in another business unit that they may or may not be aware of. And frankly, it's a good surprise, but I'm surprised that many of our existing customers where we've got tens, in some cases, hundreds of millions of business in 1 division, do not know and do not appreciate the talent, the experience that another division has. So just the more effective cross-pollination, cross-sale in existing accounts is something that I see as an opportunity, and it's relatively low-hanging because, again, in my several dozen meetings, I've always tried to say, and hey, as you're thinking about this, did you know we did this? And most of the time, the answer is, oh no, I didn't know that. Please, let's follow up. So if you scale that and then operationalize that, we're going to be able to get incremental demand from our existing base because in many cases, we've got a great beachhead, a great history and a great relationship with 1 offering and a customer, but that should be a gateway, an effective gateway, a fast gateway to compete with the other offerings. And that mechanism, that orchestration, that collaboration, that packaging up of stories, as I've mentioned before, all of that is happening as we speak. And frankly, it wasn't happening at a good level before.
James Faucette: And it sounds like then for the most part, I mean, you've talked about some incremental partnerships, for example, on the insurance side. But it sounds like you feel like you have all the, or at least a majority of assets to be able to execute and deliver that cross-sell. Is that fair or are there other things that you think you're going to need to add into the mix?
Raul Fernandez: No. We have what we need to compete. We have what we need to compete profitably and grow. We have to get some internal systems aligned. We've got a, as I mentioned earlier, a deduped streamline and do some work that should have been done before that wasn't, but we're going to get it done with speed. And we've got to perform every day, every week, every quarter, while we transform and transformation is the restructuring, and we've got to do both quickly.
James Faucette: Great. Thank you so much.
Operator: Your next question comes from the line of Bradley Clark with BMO Capital Markets. Your line is open.
Bradley Clark: Hi. Thank you. This is Brad on for Keith Bachman. I want to ask about your thoughts on GIS and market growth over time. You've alluded to sort of participating in just broader GIS market growth where you're complying perhaps low single-digit decline over time. Is that still how you're thinking about potential growth of both the market and/or GIS longer term, given the changes you'll be making to the business?
RobDel Bene: Yes. Bradley, I think that's about right. We have a very realistic view of the market. And our goal is after rationalizing the portfolio and focusing on exiting unprofitable contracts and being selective, our goal is to get to market growth rates, which we see in the low negative single-digit range. So that's where we're pointing the business in that direction.
Raul Fernandez: And just to be clear, we're operating at a worse level than that. So the first goal is to get to "normal" or more baseline with other competitors. And once we get there, then obviously the next step is just to find another target and try to meet and beat it. But in the near term, it is to get in line with our competitors with regards to our growth rate where it is today and where it should be as a comp.
Bradley Clark: Okay. Appreciate it guys.
Operator: This concludes the question-and-answer session. I'll turn the call to Raul Fernandez for closing remarks.
Raul Fernandez: Thank you very much for joining us. I appreciate all of the employees that come together every day to deliver great services for our customers, and value all the investors. I definitely also appreciate the sense of frustration and urgency to get things done, and that is what I'm 100% focused on. So thank you very much for attending today.
Operator: This concludes today's conference call. Thank you for joining. You may now disconnect your lines.
Subscribe now to gain full access to the earnings summary, 5 years analyst estimates and more exclusive content.
Subscribe NowWARNING: AI-generated summary.
While this is a phenomenal tool that can save you time and provide meaningful insights and key takeaways from the earnings call, it may contain inaccuracies or misinterpretations. For precise information, please refer to the original transcript.
(* All numbers are in thousands)
Fiscal Year | 2015 | 2016 | 2017 | 2018 | 2019 | 2020 | 2021 | 2022 | 2023 | 2024 |
---|---|---|---|---|---|---|---|---|---|---|
Revenue | 12,173,000 | 7,106,000 | 7,607,000 | 21,733,000 | 20,753,000 | 19,577,000 | 17,729,000 | 16,265,000 | 14,430,000 | 13,667,000 |
Cost Of Revenue | 9,534,000 | 5,185,000 | 5,545,000 | 16,317,000 | 14,946,000 | 14,901,000 | 14,086,000 | 12,683,000 | 11,246,000 | 11,980,000 |
Gross Profit | 2,639,000 | 1,921,000 | 2,062,000 | 5,416,000 | 5,807,000 | 4,676,000 | 3,643,000 | 3,582,000 | 3,184,000 | 1,687,000 |
Research And Development Expenses | 67,000 | 0 | 0 | 0 | 0 | 0 | 0 | 0 | 0 | 0 |
General And Administrative Expenses | 0 | 0 | 0 | 2,010,000 | 1,959,000 | 0 | 2,176,000 | 342,000 | 2,555,000 | 1,544,000 |
Selling And Marketing Expenses | 0 | 0 | 0 | -120,000 | 0 | 0 | -110,000 | 1,066,000 | -1,180,000 | -323,000 |
Selling General And Administrative Expenses | 1,537,000 | 1,040,000 | 1,279,000 | 1,890,000 | 1,959,000 | 2,050,000 | 2,066,000 | 1,408,000 | 1,375,000 | 1,221,000 |
Other Expenses | -12,000 | 9,000 | 2,000 | 522,000 | 306,000 | 1,942,000 | 1,970,000 | 1,717,000 | 1,519,000 | 35,000 |
Operating Expenses | 2,514,000 | 1,698,000 | 1,926,000 | 3,685,000 | 3,927,000 | 3,992,000 | 4,036,000 | 3,125,000 | 2,894,000 | 1,221,000 |
Cost And Expenses | 12,048,000 | 6,883,000 | 7,471,000 | 20,002,000 | 18,873,000 | 18,893,000 | 18,122,000 | 15,808,000 | 14,140,000 | 13,201,000 |
Interest Income | 20,000 | 38,000 | 35,000 | 89,000 | 128,000 | 165,000 | 98,000 | 65,000 | 135,000 | 214,000 |
Interest Expense | 148,000 | 123,000 | 117,000 | 320,000 | 334,000 | 383,000 | 361,000 | 204,000 | 200,000 | 298,000 |
Depreciation And Amortization | 977,000 | 669,000 | 658,000 | 2,014,000 | 2,023,000 | 2,032,000 | 2,058,000 | 1,827,000 | 1,627,000 | 1,404,000 |
EBITDA | 1,110,000 | 1,037,000 | 831,000 | 4,356,000 | 4,337,000 | 3,529,000 | 1,591,000 | 3,345,000 | 892,000 | 1,870,000 |
Operating Income | 125,000 | 223,000 | 136,000 | 2,638,000 | 1,880,000 | 1,569,000 | -397,000 | 1,603,000 | -659,000 | 466,000 |
Total Other Income Expenses Net | -273,000 | -128,000 | -228,000 | -196,000 | -159,000 | -6,797,000 | 1,051,000 | -462,000 | -226,000 | -357,000 |
income Before Tax | -276,000 | 10,000 | -174,000 | 1,304,000 | 1,515,000 | -5,228,000 | 654,000 | 1,141,000 | -885,000 | 109,000 |
Income Tax Expense | -312,000 | -55,000 | -74,000 | -242,000 | 288,000 | 130,000 | 800,000 | 405,000 | -319,000 | 23,000 |
Net Income | -8,000 | 244,000 | -123,000 | 1,751,000 | 1,257,000 | -5,358,000 | -146,000 | 718,000 | -566,000 | 91,000 |
Eps | -0.060 | 1.760 | -0.880 | 6.150 | 4.530 | -20.720 | -0.570 | 2.870 | -2.470 | 0.460 |
Eps Diluted | -0.060 | 1.730 | -0.880 | 6.040 | 4.470 | -20.720 | -0.570 | 2.810 | -2.470 | 0.460 |
Weighted Average Shares Outstanding | 142,192.115 | 138,280 | 139,772.727 | 284,930 | 277,540 | 258,570 | 254,140 | 250,020 | 228,990 | 195,800 |
Weighted Average Shares Outstanding Diluted | 142,560 | 141,330 | 140,390 | 289,770 | 281,430 | 258,570 | 254,140 | 255,210 | 228,990 | 198,780 |
Currency | USD | USD | USD | USD | USD | USD | USD | USD | USD | USD |
(* All numbers are in thousands)
Fiscal Year | 2015 | 2016 | 2017 | 2018 | 2019 | 2020 | 2021 | 2022 | 2023 | 2024 |
---|---|---|---|---|---|---|---|---|---|---|
Cash And Cash Equivalents | 2,098,000 | 1,178,000 | 1,263,000 | 2,593,000 | 2,899,000 | 3,679,000 | 2,968,000 | 2,672,000 | 1,858,000 | 1,224,000 |
Short Term Investments | 0 | 66,000 | 0 | 0 | 0 | 0 | 0 | 0 | 0 | 0 |
Cash And Short Term Investments | 2,098,000 | 1,178,000 | 1,263,000 | 2,593,000 | 2,899,000 | 3,679,000 | 2,968,000 | 2,672,000 | 1,858,000 | 1,224,000 |
Net Receivables | 2,369,000 | 1,827,000 | 1,643,000 | 5,481,000 | 5,218,000 | 4,392,000 | 4,156,000 | 3,854,000 | 3,441,000 | 3,253,000 |
Inventory | 0 | 12,000 | 0 | 1,077,000 | 627,000 | 646,000 | 727,000 | 652,000 | 570,000 | 0 |
Other Current Assets | 438,000 | 403,000 | 341,000 | 469,000 | 345,000 | 270,000 | 357,000 | 268,000 | 255,000 | 658,000 |
Total Current Assets | 4,905,000 | 3,420,000 | 3,247,000 | 9,620,000 | 9,089,000 | 8,987,000 | 8,208,000 | 7,446,000 | 6,124,000 | 5,135,000 |
Property Plant Equipment Net | 1,583,000 | 1,025,000 | 903,000 | 3,363,000 | 3,179,000 | 4,975,000 | 4,312,000 | 3,545,000 | 2,888,000 | 2,402,000 |
Goodwill | 1,671,000 | 1,272,000 | 1,855,000 | 7,619,000 | 7,606,000 | 2,017,000 | 641,000 | 617,000 | 539,000 | 532,000 |
Intangible Assets | 1,077,000 | 1,046,000 | 1,794,000 | 7,179,000 | 5,939,000 | 5,731,000 | 4,043,000 | 3,378,000 | 2,569,000 | 2,130,000 |
Goodwill And Intangible Assets | 2,748,000 | 2,318,000 | 3,649,000 | 14,798,000 | 13,545,000 | 7,748,000 | 4,684,000 | 3,995,000 | 3,108,000 | 2,662,000 |
Long Term Investments | 18,000 | 0 | 5,000 | 6,000 | 53,000 | 51,000 | 57,000 | 51,000 | 48,000 | 751,000 |
Tax Assets | -18,000 | 338,000 | 381,000 | 373,000 | 329,000 | 265,000 | 289,000 | 221,000 | 460,000 | 804,000 |
Other Non Current Assets | 965,000 | 658,000 | 478,000 | 5,761,000 | 3,305,000 | 3,980,000 | 4,488,000 | 4,881,000 | 3,217,000 | 2,117,000 |
Total Non Current Assets | 5,296,000 | 4,339,000 | 5,416,000 | 24,301,000 | 20,411,000 | 17,019,000 | 13,830,000 | 12,693,000 | 9,721,000 | 8,736,000 |
Other Assets | 0 | 0 | 0 | 0 | 0 | 0 | 0 | 0 | 0 | 0 |
Total Assets | 10,201,000 | 7,759,000 | 8,663,000 | 33,921,000 | 29,500,000 | 26,006,000 | 22,038,000 | 20,139,000 | 15,845,000 | 13,871,000 |
Account Payables | 422,000 | 341,000 | 410,000 | 1,513,000 | 1,666,000 | 1,598,000 | 914,000 | 840,000 | 782,000 | 846,000 |
Short Term Debt | 904,000 | 781,000 | 738,000 | 1,918,000 | 1,942,000 | 1,758,000 | 1,585,000 | 1,288,000 | 817,000 | 553,000 |
Tax Payables | 0 | 40,000 | 38,000 | 145,000 | 208,000 | 87,000 | 398,000 | 197,000 | 120,000 | 134,000 |
Deferred Revenue | 680,000 | 451,000 | 556,000 | 1,768,000 | 1,721,000 | 1,021,000 | 1,079,000 | 1,053,000 | 1,054,000 | 866,000 |
Other Current Liabilities | 1,595,000 | 1,009,000 | 1,246,000 | 4,653,000 | 4,007,000 | 3,518,000 | 4,572,000 | 3,672,000 | 2,534,000 | 2,129,000 |
Total Current Liabilities | 3,601,000 | 2,582,000 | 2,950,000 | 9,852,000 | 9,336,000 | 7,895,000 | 8,150,000 | 6,853,000 | 5,187,000 | 4,394,000 |
Long Term Debt | 1,765,000 | 1,863,000 | 2,225,000 | 6,092,000 | 5,470,000 | 9,735,000 | 5,383,000 | 4,880,000 | 4,548,000 | 3,576,000 |
Deferred Revenue Non Current | 412,000 | 348,000 | 286,000 | 795,000 | 256,000 | 735,000 | 622,000 | 862,000 | 788,000 | 671,000 |
Deferred Tax Liabilities Non Current | 0 | 795,000 | 765,000 | 1,329,000 | 1,184,000 | 1,918,000 | 1,667,000 | 994,000 | 587,000 | 130,000 |
Other Non Current Liabilities | 1,474,000 | 160,000 | 271,000 | 2,016,000 | 1,520,000 | 594,000 | 908,000 | 1,175,000 | 915,000 | 2,034,000 |
Total Non Current Liabilities | 3,651,000 | 3,166,000 | 3,547,000 | 10,232,000 | 8,430,000 | 12,982,000 | 8,580,000 | 7,911,000 | 6,838,000 | 6,411,000 |
Other Liabilities | 0 | 0 | 0 | 0 | 0 | 0 | 0 | 0 | 0 | 0 |
Capital Lease Obligations | 202,000 | 69,000 | 37,000 | 616,000 | 482,000 | 1,545,000 | 1,456,000 | 1,203,000 | 965,000 | 739,000 |
Total Liabilities | 7,252,000 | 5,748,000 | 6,497,000 | 20,084,000 | 17,766,000 | 20,877,000 | 16,730,000 | 14,764,000 | 12,025,000 | 10,805,000 |
Preferred Stock | 28,000 | 0 | 0 | 0 | 0 | 0 | 0 | 0 | 0 | 255,000 |
Common Stock | 148,000 | 149,000 | 152,000 | 3,000 | 3,000 | 3,000 | 3,000 | 3,000 | 2,000 | 2,000 |
Retained Earnings | 912,000 | 33,000 | -170,000 | 1,301,000 | 478,000 | -5,177,000 | -5,331,000 | -4,450,000 | -4,665,000 | -3,839,000 |
Accumulated Other Comprehensive Income Loss | 21,000 | -111,000 | -162,000 | 58,000 | -244,000 | -603,000 | -302,000 | -385,000 | -774,000 | -732,000 |
Other Total Stockholders Equity | 1,840,000 | 1,940,000 | 2,068,000 | 12,125,000 | 11,147,000 | 10,906,000 | 10,938,000 | 10,207,000 | 9,257,000 | 7,125,000 |
Total Stockholders Equity | 2,949,000 | 2,011,000 | 1,888,000 | 13,487,000 | 11,384,000 | 5,129,000 | 5,308,000 | 5,375,000 | 3,820,000 | 2,811,000 |
Total Equity | 2,977,000 | 2,018,000 | 2,166,000 | 13,837,000 | 11,707,000 | 5,473,000 | 5,643,000 | 5,698,000 | 4,143,000 | 3,066,000 |
Total Liabilities And Stockholders Equity | 10,201,000 | 7,759,000 | 8,663,000 | 33,921,000 | 29,473,000 | 26,006,000 | 22,038,000 | 20,139,000 | 15,845,000 | 13,871,000 |
Minority Interest | 28,000 | 7,000 | 278,000 | 350,000 | 323,000 | 344,000 | 335,000 | 323,000 | 323,000 | 255,000 |
Total Liabilities And Total Equity | 10,201,000 | 7,759,000 | 8,663,000 | 33,921,000 | 29,473,000 | 26,006,000 | 22,038,000 | 20,139,000 | 15,845,000 | 13,871,000 |
Total Investments | 18,000 | 66,000 | 5,000 | 6,000 | 53,000 | 51,000 | 57,000 | 51,000 | 48,000 | 751,000 |
Total Debt | 2,669,000 | 2,644,000 | 2,963,000 | 8,010,000 | 7,412,000 | 11,493,000 | 6,968,000 | 6,168,000 | 5,365,000 | 4,868,000 |
Net Debt | 571,000 | 1,466,000 | 1,700,000 | 5,417,000 | 4,513,000 | 7,814,000 | 4,000,000 | 3,496,000 | 3,507,000 | 3,644,000 |
Currency | USD | USD | USD | USD | USD | USD | USD | USD | USD | USD |
(* All numbers are in thousands)
Fiscal Year | 2015 | 2016 | 2017 | 2018 | 2019 | 2020 | 2021 | 2022 | 2023 | 2024 |
---|---|---|---|---|---|---|---|---|---|---|
Net Income | 7,000 | 256,000 | -100,000 | 1,782,000 | 1,262,000 | -5,358,000 | -146,000 | 736,000 | -566,000 | 91,000 |
Depreciation And Amortization | 977,000 | 767,000 | 658,000 | 2,014,000 | 2,023,000 | 1,960,000 | 1,988,000 | 1,742,000 | 1,551,000 | 1,404,000 |
Deferred Income Tax | -449,000 | -37,000 | -92,000 | -842,000 | 97,000 | -56,000 | -403,000 | 255,000 | -609,000 | -416,000 |
Stock Based Compensation | 68,000 | 46,000 | 75,000 | 93,000 | 74,000 | 68,000 | 56,000 | 101,000 | 108,000 | 109,000 |
Change In Working Capital | 44,000 | -427,000 | 260,000 | 215,000 | -1,812,000 | -1,566,000 | -817,000 | -1,063,000 | -685,000 | -529,000 |
Accounts Receivables | 237,000 | 138,000 | 586,000 | 74,000 | -947,000 | 3,000 | 53,000 | 228,000 | -1,000 | 176,000 |
Inventory | 131,000 | -172,000 | -313,000 | 107,000 | -739,000 | -3,000 | -53,000 | 0 | 0 | 0 |
Accounts Payables | -335,000 | -356,000 | 54,000 | -96,000 | -52,000 | -565,000 | -527,000 | -714,000 | -424,000 | -278,000 |
Other Working Capital | 11,000 | -37,000 | -67,000 | 130,000 | -74,000 | -1,001,000 | -290,000 | -577,000 | -260,000 | -427,000 |
Other Non Cash Items | 786,000 | 197,000 | 177,000 | -157,000 | 139,000 | 7,302,000 | -554,000 | -270,000 | 1,616,000 | 3,721,000 |
Net Cash Provided By Operating Activities | 1,433,000 | 802,000 | 978,000 | 3,105,000 | 1,783,000 | 2,350,000 | 124,000 | 1,501,000 | 1,415,000 | 1,361,000 |
Investments In Property Plant And Equipment | -648,000 | -641,000 | -487,000 | -763,000 | -558,000 | -585,000 | -515,000 | -549,000 | -455,000 | -605,000 |
Acquisitions Net | -62,000 | -517,000 | -431,000 | -203,000 | -430,000 | -1,997,000 | 5,131,000 | 533,000 | -147,000 | 101,000 |
Purchases Of Investments | 0 | -70,000 | 0 | -67,000 | 0 | -75,000 | 0 | 0 | 0 | 0 |
Sales Maturities Of Investments | 0 | -285,000 | 0 | 0 | 0 | 38,000 | 0 | 24,000 | 0 | 0 |
Other Investing Activites | 174,000 | 333,000 | -8,000 | 1,147,000 | 1,057,000 | 482,000 | 49,000 | -68,000 | -33,000 | 13,000 |
Net Cash Used For Investing Activites | -536,000 | -1,180,000 | -926,000 | 181,000 | 69,000 | -2,137,000 | 4,665,000 | -60,000 | -635,000 | -491,000 |
Debt Repayment | -274,000 | -3,957,000 | -3,188,000 | -5,641,000 | -6,409,000 | -1,794,000 | -10,334,000 | -4,767,000 | -574,000 | -533,000 |
Common Stock Issued | 196,000 | 5,545,000 | 54,000 | 4,161,000 | 6,307,000 | 11,000 | 1,000 | 13,000 | 2,000 | 0 |
Common Stock Repurchased | -842,000 | -73,000 | -13,000 | -132,000 | -1,344,000 | -752,000 | -7,000 | -628,000 | -686,000 | -898,000 |
Dividends Paid | -128,000 | -430,000 | -78,000 | -174,000 | -210,000 | -214,000 | -53,000 | 0 | 0 | 0 |
Other Financing Activites | 10,000 | -1,570,000 | 3,359,000 | -104,000 | -7,000 | -171,000 | 4,917,000 | 3,577,000 | -247,000 | -56,000 |
Net Cash Used Provided By Financing Activities | -1,038,000 | -485,000 | 93,000 | -1,890,000 | -1,663,000 | 657,000 | -5,476,000 | -1,818,000 | -1,507,000 | -1,487,000 |
Effect Of Forex Changes On Cash | -204,000 | -57,000 | -60,000 | 65,000 | -19,000 | -90,000 | 39,000 | 29,000 | -97,000 | -17,000 |
Net Change In Cash | -345,000 | -920,000 | 85,000 | 1,461,000 | 170,000 | 780,000 | -711,000 | -296,000 | -814,000 | -634,000 |
Cash At End Of Period | 2,098,000 | 1,178,000 | 1,263,000 | 2,729,000 | 2,899,000 | 3,679,000 | 2,968,000 | 2,672,000 | 1,858,000 | 1,224,000 |
Cash At Beginning Of Period | 2,443,000 | 2,098,000 | 1,178,000 | 1,268,000 | 2,729,000 | 2,899,000 | 3,679,000 | 2,968,000 | 2,672,000 | 1,858,000 |
Operating Cash Flow | 1,433,000 | 802,000 | 978,000 | 3,105,000 | 1,783,000 | 2,350,000 | 124,000 | 1,501,000 | 1,415,000 | 1,361,000 |
Capital Expenditure | -648,000 | -641,000 | -487,000 | -763,000 | -558,000 | -585,000 | -515,000 | -549,000 | -455,000 | -605,000 |
Free Cash Flow | 785,000 | 161,000 | 491,000 | 2,342,000 | 1,225,000 | 1,765,000 | -391,000 | 952,000 | 960,000 | 756,000 |
Currency | USD | USD | USD | USD | USD | USD | USD | USD | USD | USD |
(* All numbers are in thousands)
Revenue (TTM) : | P/S (TTM) : | 0.29 | ||
Net Income (TTM) : | P/E (TTM) : | 158.48 | ||
Enterprise Value (TTM) : | 7.308B | EV/FCF (TTM) : | 12.58 | |
Dividend Yield (TTM) : | 0 | Payout Ratio (TTM) : | 0 | |
ROE (TTM) : | 0.01 | ROIC (TTM) : | 0.02 | |
SG&A/Revenue (TTM) : | 0.09 | R&D/Revenue (TTM) : | 0 | |
Net Debt (TTM) : | 13.667B | Debt/Equity (TTM) | 1.45 | P/B (TTM) : | 1.28 | Current Ratio (TTM) : | 1.25 |
Trading Metrics:
Open: | Previous Close: | |||
Day Low: | Day High: | |||
Year Low: | Year High: | |||
Price Avg 50: | Price Avg 200: | |||
Volume: | Average Volume: |