ARTNA
Artesian Resources Corporation
$33
-0.05
(-0.15%)
| Exchange: | |
| Market Cap: | 341.145M |
| Shares Outstanding: | 2.333M |
About The Company
| Sector: | Utilities | |||||
| Industry: | Regulated Water | |||||
| CEO: | Nicholle R. Taylor | |||||
| Full Time Employees: | 245 | |||||
| Address: |
|
|||||
| Website: | https://www.artesianresources.com |
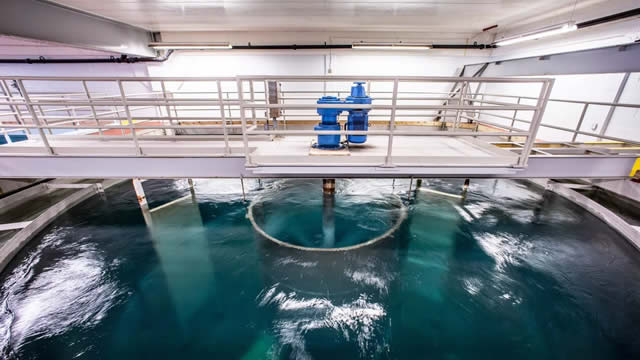
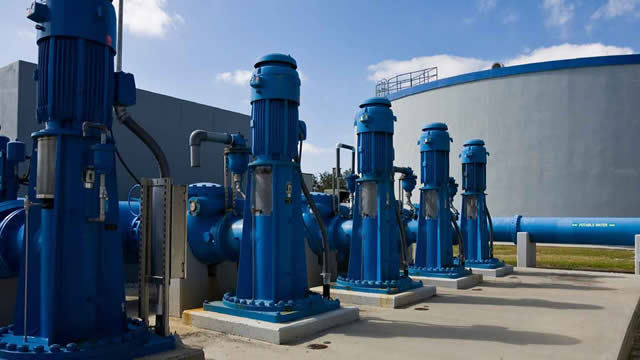
Artesian Resources Corporation, through its subsidiaries, provides water, wastewater, and other services in Delaware, Maryland, and Pennsylvania. The company distributes and sells water to residential, commercial, industrial, governmental, municipal, and utility customers, as well as for public and private fire protection in the states of Delaware, Maryland, and Pennsylvania; and offers wastewater collection, treatment infrastructure, and wastewater services to customers in Delaware. It also provides contract water and wastewater services; water, sewer, and internal service line protection plans; and wastewater management services, as well as design, construction, and engineering services. In addition, the company offers services to other water utilities, including operations and billing functions; owns real estate properties, including land for office buildings, a water treatment plant, and wastewater facility; and provides design, installation, maintenance, and repair services related to existing or proposed storm water management systems. As of December 31, 2021, it served approximately 91,700 customers in Delaware, 2,500 customers in Maryland, and 40 customers in Pennsylvania through 1,368 miles of transmission and distribution mains. Artesian Resources Corporation was founded in 1905 and is headquartered in Newark, Delaware.
Click to read more…
Revenue Segmentation
EPS
Earnings Call
Income Statement
(* All numbers are in thousands)
Balance Sheet
(* All numbers are in thousands)
Cash Flow Statement
(* All numbers are in thousands)
Analyst Estimates
(* All numbers are in thousands)


