Exchange: | NYSE |
Market Cap: | 810.645M |
Shares Outstanding: | 127.713M |
Sector: | Technology | |||||
Industry: | Semiconductors | |||||
CEO: | Mr. Gregg A. Lowe | |||||
Full Time Employees: | 4802 | |||||
Address: |
|
|||||
Website: | https://www.wolfspeed.com |
Click to read more…
Operator: Good afternoon. Thank you for attending the Wolfspeed Inc. Q4 Fiscal Year '24 Earnings Call. My name is Matt, and I'll be your moderator for today's call. All lines may be muted during the presentation portion of the call for an opportunity for questions-and-answer at the end. [Operator Instructions] I would now like to pass the conference over to our host, Tyler Gronbach, VP External Affairs; Tyler, please go ahead.
Tyler Gronbach: Thank you, operator, and good afternoon, everyone. Welcome to Wolfspeed's fourth quarter fiscal 2024 conference call. Today, Wolfspeed’s CEO, Gregg Lowe; and Wolfspeed’s CFO, Neill Reynolds will report on the results for the fourth quarter of fiscal year 2024. Please note that we will be presenting non-GAAP financial results during today's call, which we believe provides a useful information to our investors. Non-GAAP results are not in accordance with GAAP and may not be comparable to non-GAAP information provided by other companies. Non-GAAP information should be considered as a supplement to, and not a substitute for financial statements prepared in accordance with GAAP. A reconciliation to the most directly comparable GAAP measures is in our press release and posted in the Investor Relations section of our website, along with a historical summary of other key metrics. Today's discussion includes forward-looking statements about our business outlook, and we may make other forward-looking statements during the call. Such forward-looking statements are subject to numerous risks and uncertainties. Our press release today and the SEC filings noted in the release mention important factors that could cause actual results to differ materially. Last note that all discussions today will be on a continuing operation basis. During the Q&A session, we would ask that you limit yourself to one question so that we can accommodate as many questions as possible during today's call. If you have any additional questions, please feel free to contact us after the call. And now, I'd like to turn the call over to Gregg.
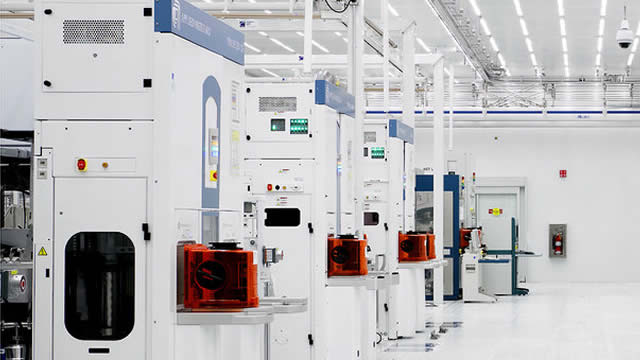
Gregg Lowe: Good afternoon, everyone. Thank you for joining us today. As we did on the last call, I'd like to discuss a few thoughts that I know are top of mind. First, we are acting on an aggressive plan to optimize our capital structure for both the near and the long-term. We've already begun to align the pace of CapEx to our current balance sheet and identify areas to reduce cost and improve profitability across all aspects of the business. As we've discussed previously, our 200 millimeter device fab is currently producing solid results at lower costs than our Durham 150 millimeter fab, while also presenting significant die cost advantages. This improved profitability gives us the confidence to accelerate the shift of our device fabrication to Mohawk Valley, while we assess the timing of the closure of our 150 millimeter device fab. The team is currently working on these plans, and we intend to provide an update on our next earnings call. We believe these actions can generate meaningful cash savings, providing us with greater flexibility to optimize our capital structure. We have already targeted $200 million of CapEx reductions in fiscal 2025. Neill will discuss this in more detail shortly. As we said last quarter, as we close out much of our fixed facility spend by the end of December 2024, our future CapEx spend is variable and can be modulated up or down. Later on, Neill will touch more on what this means for our fiscal 2025 and fiscal 2026 CapEx. We continue to aggressively drive the process of securing additional funding for the business, particularly with the CHIPS office. While we are limited in what we can say publicly, our constructive discussions with the CHIPS office on a preliminary memorandum of terms or PMT continue. While there can be no assurance that we will reach an agreement, we are now down to negotiating the final terms and conditions of the PMT. Separately, as part of the CHIPS program, we are eligible for more than $1 billion in Section 48D cash tax refunds from the IRS, of which we've already accrued approximately $640 million. As the world's largest producer of silicon carbide material, we believe we have a compelling proposition for a CHIPS grant because silicon carbide is considered a matter of national security, is designated a critical material by the U.S. Department of Energy and is essential to the electric vehicle ecosystem. Next, improving operational performance at our manufacturing sites also remains a key focus, as we ramp our 200 millimeter output. As you know, our U.S. 200 millimeter footprint for materials and devices is a key competitive advantage. On the material side, our progress on our 200 millimeter platform has been substantial. Crystal growth and substate processing out of Building 10 in Duram continues to scale and we expect to be able to support a 25% wafer start utilization at Mohawk Valley in the September quarter, one quarter ahead of plan. As a result of continued productivity improvements, we are also now expecting Building 10 to support 30% wafer start utilization at Mohawk Valley in the March quarter of 2025. These productivity improvements allow for a more measured ramp and, therefore, measured spend on The JP. At The JP, we powered up the initial furnaces last quarter and are actively qualifying crystals this quarter. We processed the first pool from The JP through the Durham line and are seeing that the quality is in line with the great performance we're seeing out of Building 10. Construction continues to progress well, and we are still confident in our schedule to have the full flow qualified in delivering wafers to Mohawk Valley by summer of 2025. On the device side, fab yields in Mohawk Valley are ahead of plan, and unit costs are well below those in Durham. There is plenty of progress still to come, but it's great to see we're ahead of our most recent projections. As previously mentioned, we are accelerating the transition of our Device business to 200 millimeter. By the March quarter, we plan to move nearly all EV powertrain production to Mohawk Valley. Because of the success of the entire 200 millimeter effort, this gives us the confidence to move forward with plans to migrate our device manufacturing from our 150 millimeter fab to the 200 millimeter fab in Mohawk Valley. Lastly, as I outlined last quarter, the market is clearly not valuing the company consistent with our technology, the business we've built or the strategic potential of the business. In light of this disconnect, the management team and the Board of Directors routinely consider alternatives to enhance value for shareholders. Having laid out those points, let's move to the specifics of Wolfspeed's fourth quarter performance. The Mohawk Valley Fab generated $41 million in revenue for the quarter, on the lower end of our estimated range, which was the result of an EV customer deferring delivery of several million dollars’ worth of product. We expect to recognize this revenue in fiscal 2025 and believe we would have landed in line or slightly above the midpoint of our Mohawk Valley revenue guidance, excluding this push out. We passed internal qualification for nearly all automotive powertrain products in late July and now have only a handful of customer qualifications left to complete, giving us the confidence that those products can be serviced out of Mohawk Valley, sooner than we originally anticipated. While the ramp of EVs is slower than previously projected, and many companies in the semiconductor industry are still confronting automotive headwinds, our revenue in the EV market continues to be strong because we are just at the beginning of the ramp of our Automotive business across several geographies. Our EV revenue in the fourth quarter was up more than 100% year-over-year and is expected to be up approximately 300% year-on-year in fiscal Q1. We are in the very early stages of what might be the most significant transition in the history of the auto industry. This will create a very dynamic environment as the OEMs will continue to adjust their ramp programs across their EV product portfolio. Our EV revenue has grown for three consecutive quarters despite a declining auto semiconductor market. Because some of the EV design, as we've accumulated over the last five to seven years are just beginning to ramp. We achieved an additional $2 billion in design-ins in fiscal Q4, bringing our fiscal 2024 total to over $9 billion of design-ins. We also had approximately $500 million of design-ins convert to design-wins in the fourth quarter, reflecting the initial ramp of production for those programs. As we stated previously, our design-wins backlog supports more than 125 different car models across more than 30 OEMs over the next several years. But remember, this transition is the biggest disruption in the history of the auto industry, and not all of these car models will ramp as currently projected. Some will be very successful, others less so. As such, we will need to be flexible to match our manufacturing output with this dynamic demand. Additionally, while there has been some near-term reductions in the projected EV adoption rate estimates, the adoption of silicon carbide in EVs has remained strong. Our $21 billion of EV design-ins to date is a testament to this. A recent McKinsey report highlighted that OEMs are transitioning to purpose built silicon carbide devices in next generation EVs that have higher power requirements and therefore, 800 volt battery systems. In fact, by 2027 to 2030, it is projected that more than 90% of new EVs will use 800 volt systems, which offer compelling performance advantages over traditional 400 volt systems. On that note, approximately 70% of our $2 billion design-ins from this quarter were related to 800 volt applications, underscoring our belief that this shift to higher performing and more efficient architectures will serve as a major tailwind for both silicon carbide generally and Wolfspeed specifically, given our market leading wafer and device quality. While the automotive industry has led the way in adopting silicon carbide thus far, there are critical high voltage industries in energy markets such as AI data centers, E-mobility and solar inverters, that are ripe for disruption in the coming years as more industrial and energy companies look to solve for the same efficiency, system size and system cost challenges that the automotive makers face as they were designing their next generation EVs. As we remarked earlier, silicon carbide is the path they chose to overcome those challenges. We have merely scratched the surface of silicon carbide potential use cases. Silicon carbide is integral to the electrification of a wide array of current and future applications and plays a foundational role in making our energy systems more efficient, more powerful and more reliable. And now, I'd like to pass the call over to Neill to discuss our quarterly financials and guidance.
Neill Reynolds: Thanks, Gregg. As a reminder, before we discuss our performance, all results reported today will be on a continuing operations basis and exclude the impact of our divested RF business and our results. We generated $201 million of revenue for the quarter, slightly above the midpoint of our guidance and flat sequentially. We recognized power revenue of $105 million, driven largely by the contribution from Mohawk Valley, but offset by continued weakness in industrial and energy markets. Mohawk Valley's $41 million contribution represents growth of 46% quarter-over-quarter and an exponential increase from the $1 million contribution one year ago. We achieved $64 million of revenue from our Durham Device Fab down approximately 40% year-over-year driven by continued weakness in industrial and energy markets. We also recognized Materials revenue of $96 million, above our expectations, driven by the continued strong execution of our Materials operations team. Looking to the future, given the continued yield, efficiency and capacity improvements in our 200 millimeter production, we will accelerate the transition of our Power Device business to 200 millimeter at Mohawk Valley, where we see significantly improved unit costs well ahead of our 150 millimeter device unit cost. Additionally, the Durham Fab has been running at lower levels of utilization due to the weakness in I&E markets, driving a significant level of underutilization and higher unit costs. Therefore, as Gregg mentioned, we are planning to accelerate the shift of our device fabrication to Mohawk Valley, while we assess the timing of the closure of our 150 millimeter device fab. We will come back at our next earnings call with our future device production plans, as we work through these plans internally and with our customers. I'd also like to note that this shift in production mix does not change our view that I&E products will be a substantial and important part of our product portfolio over the long term. Moving back to our financials. Non-GAAP gross margin in the fourth quarter was 5%, slightly above the midpoint of our June guidance. This includes $24 million or 1,200 basis points of expansion underutilization primarily related to Mohawk Valley. As you know, based on our June update, in the fourth quarter, our gross margin was negatively impacted by an incident at our Durham Fab, which negatively impacted non-GAAP gross margin by an incremental 500 basis points, resulting from underutilization charges, repair costs and lower yields. This resulted in adjusted EPS of negative $0.89 and was above the midpoint of our June guidance. Regarding our balance sheet, we ended the fiscal year with approximately $2.2 billion of cash and liquidity on hand to support our facility ramps and growth plans. DSO was 43 days, while inventory on hand was 200 days. Free cash flow during the quarter was negative $885 million, comprised of negative $240 million of operating cash flow and $644 million of capital expenditures. As Gregg mentioned earlier, we understand very clearly that our future funding plans and capital structure are a major focus for investors. So let me take some time to explain and work through the various levers available to us. Starting with CapEx. In fiscal year 2025, we expect net capital expenditures to be approximately $1.2 billion to $1.4 billion, down $200 million from our previously communicated range, and down from the $2.1 billion that we spent in fiscal 2024. This reduction in CapEx reflects the significant improvement in yields and efficiency in our 200 millimeter materials and device facilities. We have the flexibility to take this estimate down even lower based on the demand and revenue outlook throughout the year. This level of CapEx ensures that we complete The JP Siler City materials factory on time and on budget, so that we deliver wafers to Mohawk Valley mid-next calendar year. In addition, we believe we will have the ability to achieve 30% utilization in our Mohawk Valley Fab with wafers only from Building 10 on a Durham campus, which continues to produce a steady supply of high quality 200 millimeter substrates. Looking at fiscal year 2026, our CapEx will fall off sharply, as our facility expansion projects will be complete and the vast majority of our CapEx will be related to the production tools to fill those facilities and increase capacity. We expect our gross fiscal year 2026 CapEx to be in the range of $200 million to $600 million, which does not include offsets for federal incentives, which could lower that number significantly. This would include some of the approximately $640 million of 48D tax credits as part of the CHIPS Act that we have already accrued on our balance sheet. As Gregg mentioned, we expect these tax credits to represent over $1 billion of a future funding source over time, that are not associated with a potential CHIPS grant. In addition, from an operating perspective, we are undertaking several initiatives that accelerate our path to profitability and ensure we slow our operating cash burn. Achieve positive EBITDA in the second half of this fiscal year, and drive to positive operating cash flow by early fiscal 2026. These initiatives include assessing the timing of a closure of our Durham 150 millimeter wafer fab and lowering our overall cost footprint. As Gregg mentioned earlier, we will give an update on these initiatives on our next earnings call. Lastly, from a capital raise perspective, we continue to pursue additional funding with a potential CHIPS grant being a critical milestone as to how we proceed. In addition to CHIPS, we are working closely with our lenders on plans to raise additional capital in the event we choose to go down that path. As previously mentioned, we expect to have more than $1 billion of 48D tax credits that will help fund the business over time. We are also applying for other government lending and tax credit programs that may provide us with additional access to capital. Therefore, in addition to lowering CapEx and driving towards profitability, we expect to have access to several options that would enable us to end fiscal year 2025 above our $1 billion minimum cash target. Moving on to our guidance for the first quarter of fiscal 2025. We target our revenue to be in the range of $185 million to $215 million. We target roughly $50 million to $60 million of this revenue to come from Mohawk Valley next quarter, up more than 34% from the prior quarter and up greater than $50 million year-over-year at the midpoint of our range versus the $4 million we achieved last year at this time. Next, we target non-GAAP gross margin of minus 2% to 6% with a midpoint of 2%. At the midpoint, this includes approximately 1,000 basis points of underutilization, repair costs and yield impact in the Durham fab, partially related to the fab facility incident disclosed in June, but also related to weaker industrial and energy markets, where we will look to lower inventory levels. We target non-GAAP operating expenses of approximately $128 million, inclusive of $25 million of start-up costs related to The JP. As a reminder, as Mohawk Valley utilization increases and The JP starts to come online, we will start to see incrementally less underutilization out of Mohawk Valley, but incrementally more start-up costs from The JP, which hit different lines of our P&L. Net non-operating expenses are targeted to be roughly $41 million for the first quarter. And lastly, we target non-GAAP net loss between $138 million and $140 million. Now I'll turn it over to Gregg for some closing remarks.
Gregg Lowe: Thanks, Neill. We are encouraged by the positive results we are seeing in 200 millimeter. The productivity improvements in Building 10, the yield improvements in Mohawk Valley and the progress thus far at The JP are giving us further confidence in our ability to accelerate the transition of our device platform from 150 millimeter to 200 millimeter. We've already begun to align the pace of CapEx to our current balance sheet and identify areas of opportunities to reduce costs and improve profitability across all aspects of the business, and we'll outline our plans for this transition in greater detail during the next earnings call. We are driving the process of securing additional funding for the business, particularly with the CHIPS office, while at the same time, taking very deliberate actions to reduce our costs by aligning the pace of our investments and identifying new areas across the company to improve profitability. Thanks for your continued support, and now we'll move to Q&A.
Operator: [Operator Instructions] The first question is from the line of Brian Lee with Goldman Sachs. Your line is now open.
Nick Cash: Hi, everyone. This is actually Nick Cash on the line for Brian. I just kind of wanted to dive in to Durham a little bit. I guess, one, how much of your outlook at Durham is still levered to I&E and how much visibility do you have regarding the Durham Fab for fab has finally troughed in terms of demand and margin profile? And I guess, how quickly into what level can that recover to? And I guess one more touching on, I guess, the equipment incident at the facility, you mentioned a possible $20 million impact to first quarter '25 revenue. Is that guide you guys gave inclusive of that $20 million impact? Thank you.
Gregg Lowe: Yeah. Maybe I'll start with the answer, Nick, and then I'll turn it over to Neill for a little bit more detail. Visibility on I&E, it's cloudy. So right now, it's down. We're anticipating it being down for the better part of the rest of this calendar year. And there's no sign of -- it's all going to jump back really quickly or anything like that. So it's down, and it will eventually pick back up, but when we can't really predict. And then, I'll maybe turn it over to Neill.
Neill Reynolds: Yeah. Let me just try to unpack a little bit the revenue and the gross margin trajectory. So we just guided about flat for the September quarter. As increases, I think, in our EV revenue in Mohawk Valley are being offset by, as you mentioned, lower I&E and lower Durham revenue. So as you look out into the December quarter, we anticipate seeing other solid pickup in EV and Mohawk Valley revenue, but there will likely be a decline in some of the Durham and I&E volume. Kind of the I&E, as Gregg mentioned demand flattens and we start to burn off some inventory there. Just anticipation of kind of a I&E kind of recovery as you get into the first half of calendar next year. So I think that's kind of how to think about the revenue. From a September quarter impact from the fab event, I would say, we were thinking we would be down a bit lower actually, the fab recovered, I'd say, halfway through the quarter, but we just elected to keep starts down just because of the impact of the lower I&E demand. So we'll continue to manage through that and let inventory burn off there a bit. From a gross margin perspective, again, we've been impacted by the lower I&E mix, but also the lower utilization in the fab, as these repair costs and lower yields in the fab from the June event impacted us. As I said in the prepared remarks, that was about 500 basis points in the June quarter. Now that the fab has kind of returned to normal operations, we've elected to keep those wafer starts down, just to manage inventory. So the impact I’d say both in the September quarter, both from the fab incident and the lower levels of utilization related to the lower industrial energy demand is about 1,000 basis points in the quarter. So if you looked at that underlying, we actually have a little bit of a margin pickup quarter-over-quarter, just as we start to see more volume flow through Mohawk Valley.
Operator: Thank you for your question. Next question is from the line of Harsh Kumar with Piper Sandler. Your line is now open.
Harsh Kumar: Yeah. Hey, guys. First of all, sorry about the background noise. I’m at a Starbucks. But Gregg, let me ask you the loaded question that's on every investor's mind here. I think the market has sort of liquidity concerns about Wolfspeed and it's kind of evident in the stock price decline here. So my question for you is, what is the bare minimum that you have to spend on JP assuming the Mohawk Valley is not equipped. And so, is there a way that you could materially cut down the CapEx? And then I think you also mentioned that you're looking at positive free cash flow by early 2026. Could you maybe help us bridge that between now and then?
Gregg Lowe: Okay. Thanks for the question, Harsh, and I'll kick it off. First off, the progress we're seeing out of Building 10 is exceptional. And the fact that we now know that we can feed Mohawk Valley up to 30% wafer start utilization quite frankly, puts a big pressure off of trying to get The JP up and running at some kind of superfast speed. So it obviously helps us with that. We're going to be finished with the fixed cost basically build out of The JP by the end of this calendar year. And as Neill said in his remarks, we then can build out the tools and the equipment and so forth at a pace that's aligned with what we're going to need wafer start wise out of Mohawk Valley, especially with the fact that Building 10 is able to support a significantly higher percentage. Maybe, Neill, you can hit some of the other details.
Neill Reynolds: Yeah. Harsh, I just think as you start to look forward from an operating perspective, I think as we talked about in the prepared remarks, we're going to look at driving several things here. One is obviously lower CapEx. We're going to manage that with what we're looking at from a market perspective, from a CapEx efficiency viewpoint. Secondly, we're going to the operating efficiencies within the business as well. So what that will do is drive towards EBITDA positive as we get into the back half of the year and then drive towards operating cash flow positive as you get into fiscal year 2026. And then from a funding perspective, we talked a lot in the prepared remarks, it's about these 48D tax credits. And these are things that we've already accrued $640 million for. We anticipate getting those by 2026, a significant amount of them, to help fund the business as well. So I think it's important right now that we continue to execute our build-out within the parameters we talked about. We're seeing better capital efficiency right now just because of the performance of 200 millimeter and we’ll continue down that path. But we still remain focused, I think, from a funding perspective, as you look at the overall liquidity in the business, really focused on finishing our work with the CHIPS funding and working through that process, which we still feel optimistic about.
Operator: Thank you for your question. Next question is from the line of Samik Chatterjee with JP Morgan. Your line is now open.
Joseph Cardoso: Hey. This is Joe Cardoso on for Samik Chatterjee. Just curious like the potential closure of the Durham Device Fab would be quite a shift in strategy relative to prior disclosures. I think $400 million of revenue was coming from that footprint when it's fully loaded. So just curious, if you could just dive into that or flesh it out a bit more what the exact thought process here is to close -- around closing that fab and take it out of the long-term model? And then maybe the second part of that question is, what does that imply for the existing footprint there in Durham? Thanks.
Gregg Lowe: Thanks. Thanks for the question. First, it was always the plan to ramp down 150 millimeter and transition to 200 millimeter. What's really made this decision very straightforward is the progress and productivity we're seeing across the entire 200 millimeter platform. Output from Building 10, now we're able to support 30% wafer start utilization, yields in Mohawk Valley ahead of plan. The economics of Mohawk Valley substantially more compelling than Durham, and finally, weren't scheduled to ramp to JP and seeing great results from the initial crystal run. So combine this with the fact that the industrial and energy business is down, so starting this process of transitioning the fab when we're not swimming upstream against the whole bunch of demand from I&E certainly gives us breathing room to make this happen. The key decision though was all about the progress and productivity that we see across 200 millimeter. We're super excited about that. It's actually quite an amazing accomplishment that the team has been able to do. And Neill, you can get into a little bit of detail, but that progress and productivity also gives us ability to absorb that revenue in our current footprint.
Neill Reynolds: So let me just break down a little bit, just a bit of the capital efficiency that we're seeing. So one thing I talked about is taking the CapEx level down from $1.2 billion to $1.4 billion during fiscal year 2025 and then dropping it down dramatically in fiscal year '26. So I think as Gregg said, the facility spend being complete, we can really manage our CapEx for tools going forward. And that facility will be -- the facilities costs will likely be complete by December of this year. So we plan these factories for great economies of scale, building up modularly, and we're starting to see the benefits of that as we start to exit that facility spend. The second thing is, our capital investment model is working as expected. So the good yields and the efficiency across the 200 millimeter supply chain is just resulting in a lower required amount of CapEx for each incremental dollar of revenue. So we're seeing some good performance there. So when you think about what that would mean longer term for the revenue, Joe, as you start to think about moving on beyond the Durham Fab one day, that $200 million to $600 million of fiscal year 2026 CapEx could support 50% to 60% utilization out of Mohawk Valley. So I think it's a real testament to the amount of revenue we can absorb through Mohawk Valley, and you start making that trade from 150 millimeter to 200 millimeters. So I think here in the medium term, if we go down that path, I think Mohawk Valley will have significant capability to absorb a lot of that revenue. And of course, the trade-off from industrial and energy 150 to 200 is actually a very, very good mix shift from that perspective. So we believe that the Mohawk Valley Fab will really be able to incorporate a lot of that revenue just mentioned. And we’ll – as we tighten up these plans and give more of an update, we’ll let you know how that impacts the long term model, but we’re clearly bullish on the ability of Mohawk Valley to absorb that.
Operator: Thank you for your question. Next question is from the line of Colin Rusch with Oppenheimer. Your line is now open.
Colin Rusch: Thanks so much. In terms of monetizing these tax credits that you've accrued. Are there operational metrics that you need to meet or are those things that you can actually just cut and monetize in the market? And can you talk a little bit about potential transferability on those grants?
Neill Reynolds: Hey, Colin. Thanks. Yeah. Thanks for the question. So on the tax credits, these are tax credits that were passed through the CHIPS Act, so very much aligned to those, but don't really have much operational impact other than you just have to have the assets placed into service and then you can administer those. Those get administered through your tax return process through the IRS. So that's basically how it's get out today. Some of the final terminology in terms of how that's going to work is pending, but it's passed into law, and we have very high confidence in terms of ability to monetize those in time. Tradability, etc., not so much from that perspective, but I think that if you think about our facility spend being largely done, our CapEx coming down during this year and into next year. A lot of what we've accrued and what we'll accrue during this coming year should start to come to fruition to us during 2026.
Operator: Thank you for your question. Next question is from the line of Jed Dorsheimer with William Blair. Your line is now open.
Jed Dorsheimer: Hi. Yes. Thanks for taking my question. I guess, if I -- just help me with a little back of the envelope math here. If I carry your margins in the Materials business, and then I back out underutilization in the start-up, I get about $3 million spread between Mohawk Valley and Durham. And if I use the 500 basis points, it looks like a negative or gross profit dollar loss in Durham of about $5 million. Is that correct? And that would imply about a 20% margin for Mohawk Valley. I just want to make sure I'm looking at that correctly.
Neill Reynolds: Yeah, Jed. I think I can't talk to the specifics between the different factories. But what you can gather is that the profitability coming out of Mohawk Valley is significantly better than what we're seeing at 150 millimeter in Durham. We’ve talked about it many times, Mohawk Valley highly automated fab with superior capability and state-of-the-art capability, and just significantly better from that perspective. So you can imagine that the profitability is significantly better, which obviously plays a heavy role in informing that decision.
Operator: Thank you for your question. Next question is from the line of Joshua Buchalter with TD Cowen. Your line is now open.
Joshua Buchalter: Hey, guys. Thank you for taking my question. I wanted to ask about the Mohawk Valley ramp and time lines of revenue. Is the right rule of thumb still when you reach those utilization levels, you get revenue, I think it's roughly two to three quarters later, because that would imply that you're in the fiscal third quarter of 2025, a number comfortably above $100 million out of Mohawk. And then maybe, as a follow-on to that question, what's the time line to get to the 30% beyond that and how does that coincide with The JP layering in as well? Thank you.
Neill Reynolds: Yeah. So first of all, thanks for the question. And I think as we laid out before, there's -- from a utilization perspective, there is a couple of quarter lag between the time you start a wafer to the time we start to see revenues kind of get process through the fab and then through the back-end operations as well and then eventually out to customers. So that time frame you laid out is correct. The other thing that impacts utilization and translation into revenue is the mix between automotive parts and in industrial and energy parts. The revenue per wafer, so to speak, is just much higher than industrial energy part, generally than an automotive part. If you look at the Mohawk Valley revenue just for the June quarter, for instance, we were 85% to 90% EV. If you transition that into the September quarter here, we'll be 95% plus EV and we expect it to remain that way as we push more and more of our qualified park to Mohawk Valley. On the flip side, we'll just see the Durham Fab consistently see the EV percentage of revenue start to come down over time. So as that translates into revenue, I think we talked about with heavier auto, 20 translates closer to $80 million and close to $100 million is the kind of the normal mix. So I think that's the way to think about it moving forward. Now, as we think about maybe transitioning to Durham Fab, we've put a lot more industrial and energy revenue into Mohawk Valley, which as I said before, will be a good trade for us. And then we get back to the kind of, I think, normal economics of thinking about a $2 billion fab and the percentages of supply that are capable at various levels of utilization.
Operator: Thank you for your question. The next question is from the line of Joe Moore with Morgan Stanley. Your line is now open.
Joseph Moore: Great. Thank you. I think you gave an EV number in terms of the percentage growth, but I didn't hear an absolute number. I wonder if you could help us kind of size where you are now with EV and what you're classifying as EV?
Neill Reynolds: Yeah. So on the EV revenue, as you said, EV revenue was up 2x in the quarter, 3x year-over-year and the outlook for the September quarter. It's also gone, by the way, from representing about 25% of our Power Device revenue a year ago to over 50%, even the mid-50% of our Power Device revenue here in June. And if you look here in the September quarter, more than 60% of our Power Device outlook. So we expect that to grow even further as the year goes on. So while we’ve seen some moderation, I would say, the overall EV growth rates, this has been well documented and reported and supply and demand are more matched up. We do continue to see some significant growth into the December quarter and into the first half of calendar year 2025.
Operator: Thank you for the question. Next question is from the line of Christopher Rolland with Susquehanna. Your line is now open.
Christopher Rolland: Hey, guys. Thanks for the question. Are there any more details on the incident in Durham? What exactly happened there? And then, you guys had mentioned when you were initially ramping Mohawk that you didn't have redundant lines or backup equipment there. Has this changed like over time over the past year? And do you feel comfortable that you guys would be able to absorb an equipment failure or a similar problem in Mohawk? Thanks.
Gregg Lowe: Yeah. So a couple of things. First off, the facilities issue, with the issue in the June quarter in the Durham Fab was a facilities issue, it's been rectified and repaired and it's behind us. From a Mohawk Valley perspective, there are significant amounts of redundancies, including power fees in, water and we are now -- I don't know the exact percentage, but the vast majority of the tools have second of a kind tools. And so if one tool goes down, there's another tool that can pick up for it. We're going to be at 100% very soon. I don't know exactly that date. But we have a significant amount of redundancy out of the Mohawk Valley Fab. And you would actually expect that out of a modern fab. Our fab here in Durham is a few decades years old. And we’ve got a modern highly automated fab in Mohawk Valley. So we’re very confident in its ability to withstand different incidents that might happen.
Operator: Thank you for your question. There are no additional questions waiting at this time. So I'll pass the call back to George Lowe, CEO for any closing remarks.
Gregg Lowe: Thanks, everybody for your participation today. We look forward to updating you on our next call. Thank you.
Operator: That concludes the conference call. Thank you for your participation. You may now disconnect your lines.
Subscribe now to gain full access to the earnings summary, 5 years analyst estimates and more exclusive content.
Subscribe NowWARNING: AI-generated summary.
While this is a phenomenal tool that can save you time and provide meaningful insights and key takeaways from the earnings call, it may contain inaccuracies or misinterpretations. For precise information, please refer to the original transcript.
(* All numbers are in thousands)
Fiscal Year | 2015 | 2016 | 2017 | 2018 | 2019 | 2020 | 2021 | 2022 | 2023 | 2024 |
---|---|---|---|---|---|---|---|---|---|---|
Revenue | 1,632,505 | 1,616,627 | 1,473,000 | 1,493,680 | 1,080,000 | 470,700 | 525,600 | 746,200 | 921,900 | 807,200 |
Cost Of Revenue | 1,157,549 | 1,129,553 | 1,038,428 | 1,086,038 | 689,000 | 312,200 | 361,000 | 496,900 | 642,400 | 730,900 |
Gross Profit | 474,956 | 487,074 | 434,572 | 407,642 | 391,000 | 158,500 | 164,600 | 249,300 | 279,500 | 76,300 |
Research And Development Expenses | 182,797 | 168,848 | 158,549 | 164,321 | 157,900 | 152,000 | 177,800 | 196,400 | 225,400 | 201,900 |
General And Administrative Expenses | 265,130 | 270,452 | 271,875 | 279,589 | 197,000 | 177,900 | 176,500 | 196,000 | 223,800 | 246,400 |
Selling And Marketing Expenses | 25,600 | 12,600 | 5,300 | 3,900 | 3,700 | 3,800 | 5,100 | 7,500 | 11,500 | 13,800 |
Selling General And Administrative Expenses | 290,730 | 283,052 | 277,175 | 283,489 | 200,700 | 181,700 | 181,600 | 203,500 | 235,300 | 246,400 |
Other Expenses | -10,389 | -13,035 | 14,008 | 11,642 | 43,600 | 47,400 | 43,600 | 97,500 | 52,100 | -26,700 |
Operating Expenses | 499,747 | 480,632 | 463,223 | 478,582 | 402,200 | 381,100 | 403,000 | 497,400 | 658,100 | 448,300 |
Cost And Expenses | 1,657,296 | 1,610,185 | 1,501,651 | 1,564,620 | 1,091,200 | 693,300 | 764,000 | 994,300 | 1,300,500 | 1,179,200 |
Interest Income | 9,086 | 4,472 | 3,696 | 1,827 | 12,100 | 16,300 | 10,100 | 11,800 | 58,200 | 135,000 |
Interest Expense | 0 | 0 | 0 | 0 | 355,900 | 34,900 | 45,400 | 25,100 | 42,600 | 246,300 |
Depreciation And Amortization | 26,220 | 159,145 | 150,508 | 111,600 | 122,400 | 97,100 | 120,900 | 129,800 | 164,000 | 181,000 |
EBITDA | 49,151 | 52,087 | -11,131 | 341,144 | 137,100 | -108,700 | -42,000 | -118,600 | -212,600 | -191,000 |
Operating Income | -72,513 | -10,471 | -18,672 | -329,087 | -6,500 | -222,600 | -238,400 | -248,100 | -380,600 | -372,000 |
Total Other Income Expenses Net | -58,111 | -29,948 | 23,987 | -246,505 | -38,700 | 17,000 | -101,800 | -38,000 | 50,100 | -200,500 |
income Before Tax | -82,902 | -23,506 | -4,664 | -317,445 | -45,200 | -205,600 | -340,200 | -286,100 | -328,500 | -572,500 |
Income Tax Expense | -18,851 | -1,970 | 93,454 | -37,522 | 12,700 | -8,000 | 1,100 | 9,000 | 1,400 | 1,100 |
Net Income | -64,051 | -21,536 | -98,118 | -279,968 | -57,900 | -197,600 | -341,300 | -295,100 | -329,900 | -864,200 |
Eps | -0.570 | -0.210 | -1 | -2.880 | -0.560 | -1.830 | -3.040 | -2.460 | -2.650 | -6.880 |
Eps Diluted | -0.570 | -0.210 | -1 | -2.810 | -0.560 | -1.830 | -3.040 | -2.460 | -2.650 | -6.880 |
Weighted Average Shares Outstanding | 113,022 | 101,783 | 98,487 | 97,058.823 | 103,576 | 107,935 | 112,346 | 120,120 | 124,374 | 125,693 |
Weighted Average Shares Outstanding Diluted | 113,022 | 101,783 | 98,487 | 99,530 | 103,576 | 107,935 | 112,346 | 120,120 | 124,374 | 125,693 |
Currency | USD | USD | USD | USD | USD | USD | USD | USD | USD | USD |
(* All numbers are in thousands)
Fiscal Year | 2015 | 2016 | 2017 | 2018 | 2019 | 2020 | 2021 | 2022 | 2023 | 2024 |
---|---|---|---|---|---|---|---|---|---|---|
Cash And Cash Equivalents | 139,710 | 166,154 | 132,597 | 118,924 | 500,500 | 448,800 | 379,000 | 449,500 | -9,700 | 1,045,900 |
Short Term Investments | 573,481 | 439,151 | 478,341 | 268,161 | 550,900 | 790,900 | 775,600 | 749,300 | 2,964,600 | 1,128,700 |
Cash And Short Term Investments | 713,191 | 605,305 | 610,938 | 387,085 | 1,051,400 | 1,239,700 | 1,154,600 | 1,198,800 | 2,954,900 | 2,174,600 |
Net Receivables | 186,157 | 171,915 | 156,432 | 156,309 | 129,100 | 79,000 | 102,300 | 151,500 | 155,600 | 289,800 |
Inventory | 280,576 | 300,317 | 284,385 | 296,015 | 187,400 | 121,900 | 166,600 | 227,000 | 327,500 | 461,200 |
Other Current Assets | 54,851 | 44,788 | 23,390 | 20,191 | 19,700 | 8,700 | 27,900 | 151,400 | 150,900 | 74,000 |
Total Current Assets | 1,308,250 | 1,153,482 | 1,100,630 | 890,090 | 1,412,800 | 1,592,800 | 1,478,700 | 1,762,400 | 3,625,700 | 2,999,600 |
Property Plant Equipment Net | 625,982 | 599,723 | 581,263 | 661,319 | 625,200 | 770,800 | 1,292,300 | 1,481,100 | 2,204,000 | 3,751,500 |
Goodwill | 616,345 | 618,828 | 618,828 | 620,330 | 530,000 | 349,700 | 359,200 | 359,200 | 359,200 | 359,200 |
Intangible Assets | 317,154 | 302,810 | 274,315 | 390,054 | 197,900 | 156,900 | 140,500 | 125,400 | 115,900 | 23,900 |
Goodwill And Intangible Assets | 933,499 | 921,638 | 893,143 | 1,010,384 | 727,900 | 506,600 | 499,700 | 484,600 | 475,100 | 383,100 |
Long Term Investments | 57,595 | 40,179 | 50,366 | 57,501 | 39,500 | 55,900 | 138,400 | 449,500 | 2,600 | 79,300 |
Tax Assets | 39,190 | 38,564 | 11,763 | 6,451 | 5,600 | 1,200 | 1,000 | 1,000 | 1,200 | 1,100 |
Other Non Current Assets | -19,206 | 9,249 | 12,702 | 11,800 | 5,900 | 303,700 | 36,700 | -261,100 | 312,100 | 770,000 |
Total Non Current Assets | 1,637,060 | 1,609,353 | 1,549,237 | 1,747,455 | 1,404,100 | 1,638,200 | 1,968,100 | 2,155,100 | 2,995,000 | 4,985,000 |
Other Assets | 0 | 0 | 0 | 0 | 0 | 0 | 0 | 0 | 0 | 0 |
Total Assets | 2,945,310 | 2,762,835 | 2,649,867 | 2,637,545 | 2,816,900 | 3,231,000 | 3,446,800 | 3,917,500 | 6,620,700 | 7,984,600 |
Account Payables | 154,038 | 129,060 | 133,185 | 151,307 | 200,900 | 88,100 | 381,100 | 307,700 | 570,900 | 53,000 |
Short Term Debt | 0 | 0 | 0 | 0 | 3,000 | 3,600 | 5,200 | 500 | 500 | 7,400 |
Tax Payables | 2,035 | 12,720 | 11,148 | 8,053 | 3,000 | 1,200 | 400 | 11,600 | 9,600 | 1,000 |
Deferred Revenue | 0 | 0 | 0 | 0 | 45,800 | 14,200 | 22,900 | 37,000 | 43,000 | 62,300 |
Other Current Liabilities | -64,415 | -51,066 | -65,495 | -62,374 | -185,400 | 96,000 | -341,900 | -276,000 | -533,000 | 488,600 |
Total Current Liabilities | 245,696 | 219,774 | 212,023 | 248,293 | 268,200 | 291,200 | 448,800 | 388,500 | 661,900 | 665,300 |
Long Term Debt | 200,000 | 160,000 | 145,000 | 292,000 | 469,100 | 795,200 | 833,900 | 1,031,200 | 4,184,300 | 6,161,100 |
Deferred Revenue Non Current | 0 | 0 | 0 | 0 | 0 | 9,800 | 600 | 0 | 0 | 8,900.001 |
Deferred Tax Liabilities Non Current | 12,174 | 943 | 49,860 | 3,056 | 2,000 | 1,800 | 2,500 | 3,200 | 3,900 | 10,800 |
Other Non Current Liabilities | 21,084 | 14,294 | 20,179 | 22,115 | 36,400 | 43,800 | 44,500 | 55,300 | 148,700 | 256,399.999 |
Total Non Current Liabilities | 233,258 | 175,237 | 215,039 | 317,171 | 507,500 | 850,600 | 881,500 | 1,089,700 | 4,336,900 | 6,437,200 |
Other Liabilities | 0 | 0 | 0 | 0 | 0 | 0 | 0 | 0 | 0 | 0 |
Capital Lease Obligations | 0 | 0 | 0 | 0 | 0 | 15,000 | 15,200 | 10,100 | 9,700 | 122,900 |
Total Liabilities | 478,954 | 395,011 | 427,062 | 565,464 | 775,700 | 1,141,800 | 1,330,300 | 1,478,200 | 4,998,800 | 7,102,500 |
Preferred Stock | 0 | 0 | 0 | 2 | 0 | 0 | 0 | 0 | 0 | 0 |
Common Stock | 131 | 125 | 121 | 125 | 100 | 100 | 100 | 200 | 200 | 200 |
Retained Earnings | 174,873 | -613 | -202,742 | -482,710 | -847,500 | -1,039,200 | -1,563,100 | -1,764,000 | -2,064,200 | -2,928,400 |
Accumulated Other Comprehensive Income Loss | 5,798 | 8,728 | 5,909 | 596 | 9,500 | 16,000 | 2,700 | -25,300 | -25,100 | -11,600 |
Other Total Stockholders Equity | 2,285,554 | 2,359,584 | 2,419,517 | 2,549,123 | 2,874,100 | 3,106,200 | 3,676,800 | 4,228,400 | 3,711,000 | 3,821,900 |
Total Stockholders Equity | 2,466,356 | 2,367,824 | 2,222,805 | 2,067,136 | 2,036,200 | 2,083,100 | 2,116,500 | 2,439,300 | 1,621,900 | 882,100 |
Total Equity | 2,466,356 | 2,367,824 | 2,222,805 | 2,072,081 | 2,041,200 | 2,089,200 | 2,116,500 | 2,439,300 | 1,621,900 | 882,100 |
Total Liabilities And Stockholders Equity | 2,945,310 | 2,762,835 | 2,649,867 | 2,637,545 | 2,816,900 | 3,231,000 | 3,446,800 | 3,917,500 | 6,620,700 | 7,984,600 |
Minority Interest | 0 | 0 | 0 | 4,945 | 5,000 | 6,100 | 0 | 0 | 0 | 0 |
Total Liabilities And Total Equity | 2,945,310 | 2,762,835 | 2,649,867 | 2,637,545 | 2,816,900 | 3,231,000 | 3,446,800 | 3,917,500 | 6,620,700 | 7,984,600 |
Total Investments | 631,076 | 479,330 | 528,707 | 325,662 | 590,400 | 846,800 | 775,600 | 1,198,800 | 2,967,200 | 1,208,000 |
Total Debt | 200,000 | 160,000 | 145,000 | 292,000 | 469,100 | 798,800 | 839,100 | 1,031,700 | 4,184,800 | 6,291,400 |
Net Debt | 60,290 | -6,154 | 12,403 | 173,076 | -31,400 | 350,000 | 460,100 | 582,200 | 4,194,500 | 5,245,500 |
Currency | USD | USD | USD | USD | USD | USD | USD | USD | USD | USD |
(* All numbers are in thousands)
Fiscal Year | 2015 | 2016 | 2017 | 2018 | 2019 | 2020 | 2021 | 2022 | 2023 | 2024 |
---|---|---|---|---|---|---|---|---|---|---|
Net Income | -64,051 | -21,536 | -98,118 | -279,923 | -375,100 | -197,600 | -341,300 | -295,100 | -329,900 | -573,600 |
Depreciation And Amortization | 172,286 | 159,145 | 150,508 | 153,937 | 143,600 | 97,100 | 120,900 | 129,800 | 164,000 | 181,000 |
Deferred Income Tax | -20,950 | -15,839 | 74,918 | -40,038 | -400 | -500 | 900 | 700 | 500 | 200 |
Stock Based Compensation | 64,299 | 58,728 | 47,725 | 43,203 | 78,000 | 47,200 | 53,200 | 60,900 | 81,900 | 84,900 |
Change In Working Capital | -46,034 | -16,811 | 43,104 | 34,916 | 38,800 | -41,300 | -53,900 | -102,200 | -65,700 | -347,400 |
Accounts Receivables | 37,853 | 21,800 | 16,955 | -4,764 | 22,300 | -3,200 | -23,500 | -54,300 | -4,600 | 7,400 |
Inventory | 3,528 | -23,269 | 17,918 | 10,998 | -43,300 | -8,500 | -44,600 | -68,800 | -97,500 | -152,300 |
Accounts Payables | -44,796 | -12,090 | -4,818 | 14,296 | 6,400 | -7,200 | 21,700 | 29,200 | 30,000 | -45,800 |
Other Working Capital | -42,619 | -3,252 | 13,049 | 14,386 | 53,400 | -22,400 | -7,500 | -8,300 | 6,400 | -156,700 |
Other Non Cash Items | 75,704 | 39,629 | -2,237 | 255,263 | 317,400 | 66,100 | 94,700 | 51,700 | 6,600 | 566,900 |
Net Cash Provided By Operating Activities | 181,254 | 203,316 | 215,900 | 167,358 | 202,300 | -29,000 | -125,500 | -154,200 | -142,600 | -725,600 |
Investments In Property Plant And Equipment | -225,651 | -134,461 | -99,333 | -195,803 | -153,000 | -234,300 | -576,400 | -650,600 | -962,300 | -2,279,900 |
Acquisitions Net | 19,491 | -12,513 | 12,405 | -429,162 | 219,000 | 4,400 | 43,700 | 125,000 | 101,800 | 76,000 |
Purchases Of Investments | -430,368 | -220,823 | -200,405 | -200,688 | -517,200 | -821,400 | -475,000 | -475,000 | -1,191,000 | -1,601,100 |
Sales Maturities Of Investments | 639,597 | 354,598 | 153,096 | 401,152 | 223,800 | 578,600 | 546,400 | 467,500 | 747,300 | 1,686,300 |
Other Investing Activites | -19,206 | 5,296 | -11,013 | 614 | 300 | -14,200 | 12,700 | 142,100 | 157,200 | 175,400 |
Net Cash Used For Investing Activites | -16,137 | -7,903 | -145,250 | -423,887 | -227,100 | -486,900 | -448,600 | -391,000 | -1,147,000 | -1,943,300 |
Debt Repayment | 0 | 0 | 0 | 0 | 0 | 0 | 0 | 0 | 0 | 0 |
Common Stock Issued | 36,929 | 21,682 | 17,716 | 97,521 | 158,000 | 76,400 | 539,700 | 22,400 | 23,800 | 23,400 |
Common Stock Repurchased | -549,677 | -149,553 | -104,017 | -6,200 | -21,600 | -16,900 | -36,200 | -29,100 | -19,200 | -18,000 |
Dividends Paid | 0 | 0 | 0 | 0 | 0 | 0 | 0 | 0 | 0 | 0 |
Other Financing Activites | 1,391,395 | 1,306,012 | 933,223 | 668,150 | 678,700 | 566,800 | 67,200 | 672,200 | 2,612,200 | -19,000 |
Net Cash Used Provided By Financing Activities | -311,353 | -167,859 | -104,078 | 242,671 | 406,500 | 464,300 | 504,100 | 615,900 | 2,597,100 | 1,958,000 |
Effect Of Forex Changes On Cash | -878 | -1,110 | -129 | 185 | -100 | -100 | 200 | -200 | -54,400 | -200 |
Net Change In Cash | -147,114 | 26,444 | -33,557 | -13,673 | 381,600 | -51,700 | -69,800 | 70,500 | 1,307,500 | -711,100 |
Cash At End Of Period | 139,710 | 166,154 | 132,597 | 118,924 | 500,500 | 448,800 | 379,000 | 449,500 | 1,757,000 | 1,045,900 |
Cash At Beginning Of Period | 286,824 | 139,710 | 166,154 | 132,597 | 118,900 | 500,500 | 448,800 | 379,000 | 449,500 | 1,757,000 |
Operating Cash Flow | 181,254 | 203,316 | 215,900 | 167,358 | 202,300 | -29,000 | -125,500 | -154,200 | -142,600 | -725,600 |
Capital Expenditure | -225,651 | -134,461 | -99,333 | -195,803 | -153,000 | -234,300 | -576,400 | -650,600 | -962,300 | -2,279,900 |
Free Cash Flow | -44,397 | 68,855 | 116,567 | -28,445 | 49,300 | -263,300 | -701,900 | -804,800 | -1,104,900 | -3,005,500 |
Currency | USD | USD | USD | USD | USD | USD | USD | USD | USD | USD |
(* All numbers are in thousands)
Revenue (TTM) : | P/S (TTM) : | 1.02 | ||
Net Income (TTM) : | P/E (TTM) : | -1.09 | ||
Enterprise Value (TTM) : | 6.276B | EV/FCF (TTM) : | -2.1 | |
Dividend Yield (TTM) : | 0 | Payout Ratio (TTM) : | 0 | |
ROE (TTM) : | -0.82 | ROIC (TTM) : | -0.08 | |
SG&A/Revenue (TTM) : | 0.08 | R&D/Revenue (TTM) : | 0.26 | |
Net Debt (TTM) : | 807.2M | Debt/Equity (TTM) | 9.83 | P/B (TTM) : | 1.3 | Current Ratio (TTM) : | 3.14 |
Trading Metrics:
Open: | 6.4 | Previous Close: | 6.44 | |
Day Low: | 6.11 | Day High: | 6.48 | |
Year Low: | 6.11 | Year High: | 47.43 | |
Price Avg 50: | 10.74 | Price Avg 200: | 19.87 | |
Volume: | 3.907M | Average Volume: | 12.751M |