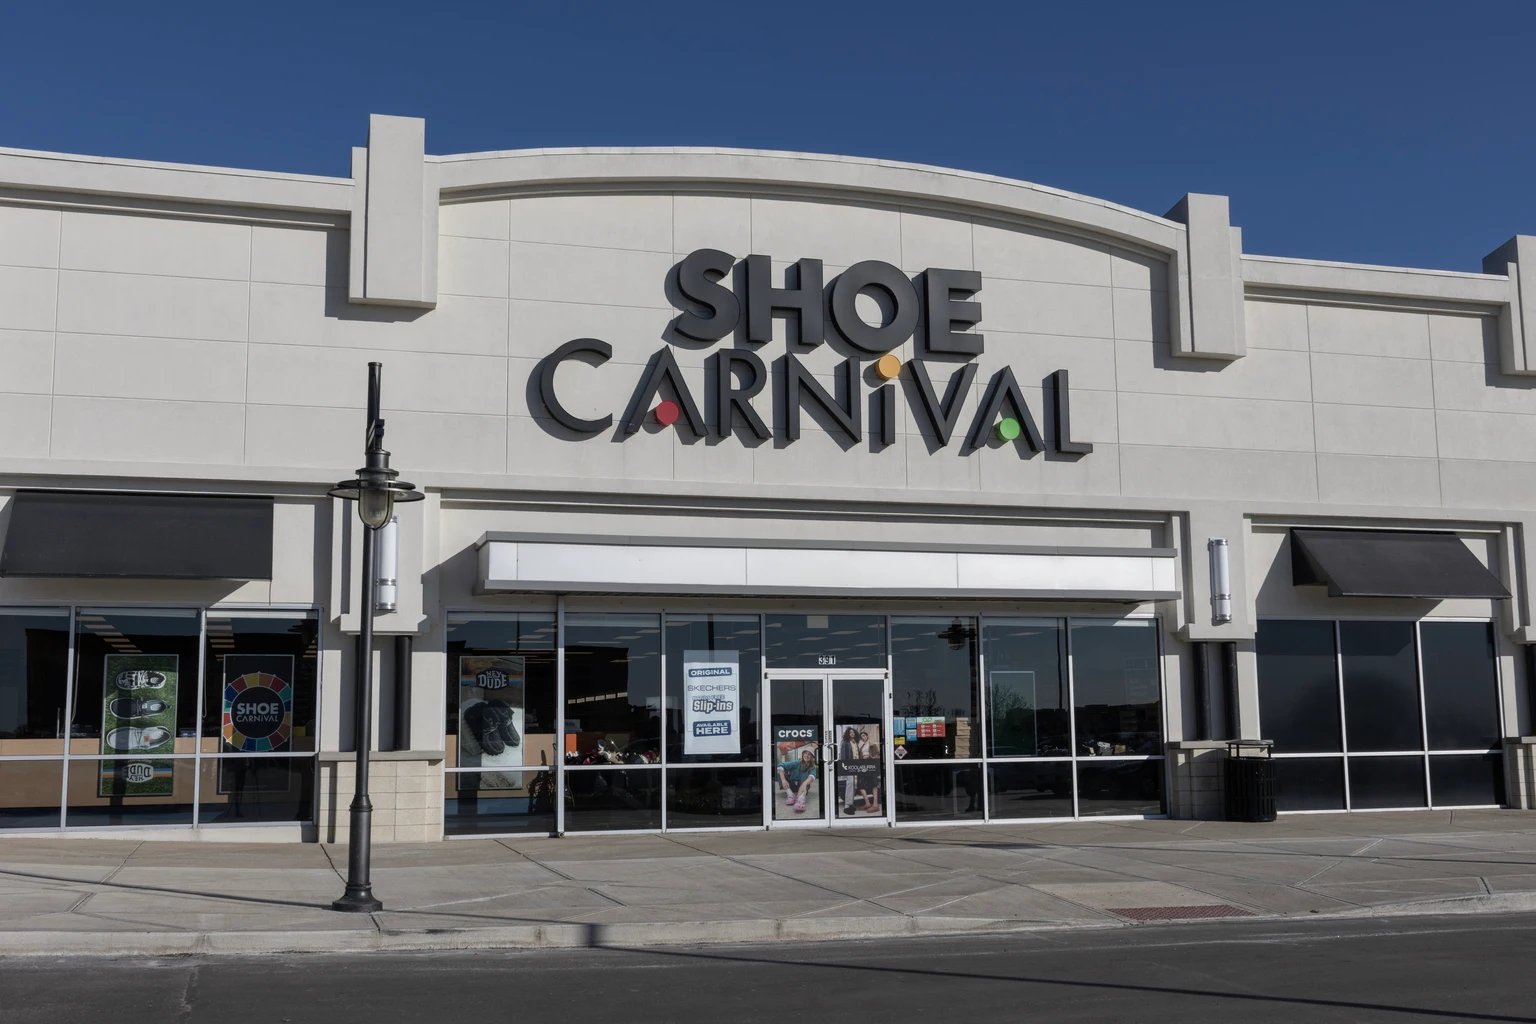
Exchange: | NASDAQ |
Market Cap: | 909.775M |
Shares Outstanding: | 27.174M |
Sector: | Consumer Cyclical | |||||
Industry: | Apparel – Retail | |||||
CEO: | Mr. Mark J. Worden | |||||
Full Time Employees: | 2300 | |||||
Address: |
|
|||||
Website: | https://www.shoecarnival.com |
Click to read more…
Operator: Good morning, and welcome to Shoe Carnival's Fourth Quarter 2023 Earnings Conference Call. Today's conference call is being recorded and is also being broadcast via webcast. Any reproduction or rebroadcast of any portion of this call is expressly prohibited.
I would now like to introduce Mr. Steve Alexander with Shoe Carnival Investor Relations. Mr. Alexander, please go ahead.
Steve Alexander: Thank you, and good morning. Thanks for joining us today. Earlier this morning, we issued our earnings press release for the fourth quarter of 2023. If you need a copy of the release, it is available on our website in the Investors section.
Joining me on today's call are Mark Worden, President and Chief Executive Officer of Shoe Carnival; Carl Scibetta, Chief Merchandising Officer; and Patrick Edwards, Chief Financial Officer.
Management's remarks today may contain forward-looking statements that involve a number of risk factors. These risk factors could cause the company's actual results to be materially different from those projected in such statements. Forward-looking statements should also be considered in conjunction with the discussion of risk factors included in the company's SEC filings and today's earnings press release. Investors are cautioned not to place undue reliance on these forward-looking statements, which speak only as of today's date. The company disclaims any obligation to update any of the risk factors or to publicly announce any revisions to the forward-looking statements discussed on today's conference call or contained in today's press release to reflect future events or developments.
Today's call will reference non-GAAP measures. The non-GAAP or adjusted results referenced exclude the purchase accounting, merger, integration and transaction costs related to the acquisition of Rogan's shoes. A reconciliation of GAAP to non-GAAP result is included in this morning's release.
And with that, I'll hand the call over to Mark.
Mark Worden: Thank you, Steve, and good morning, everyone. I'd like to start today by thanking our 5,000 team members and vendor partners for their support in driving sales growth during the December holiday period and setting us up for accelerated sales growth in fiscal 2024. Let me also take this opportunity to welcome all our new team members from the Rogan Shoes acquisition announced last month. 1 month after the acquisition, it's abundantly clear to me why Rogan's is the market leader in the state of Wisconsin. Their assortment is compelling. Brands are spot on for the target customer and the long-tenured team has a deep commitment to their customers. This combination sets us up for significant profit growth and sales expansion ahead. Welcome, team.
Before turning to 2024 growth expectations and guidance, I'll start with highlighting Q4 2023 results. First, our results were consistent with the preliminary financials announced in mid-February. We delivered net sales at the high end of our expectation with $280.2 million in the fourth quarter and $1.176 billion for the year. Excluding the transaction costs incurred in the fourth quarter related to Rogan's acquisition, adjusted EPS totaled $0.59 and was in the midrange of our expectations and adjusted EPS for the full year totaled $2.70.
Sales during the December holiday period exceeded our expectations with strong gross profit delivery again, sustaining above 35% for the 12th consecutive quarter. We posted mid-single-digit sales growth during the holiday period with balanced growth across both banners. Our growth was driven by: #1, our new holiday marketing campaign, which surrounded customers during the 2 peak holiday weeks with a new slate of social, digital and influencer marketing. The message resonated with our core customer immediately.
And #2, Carl's buying team rolled out a compelling holiday assortment with robust margins that our customers wanted for their holiday gifting list. Between the new campaign and right brands, right depth, we found the perfect combination to capture customer share of wallet when they were ready to shop for the holiday. The wins from the December holiday season were built from the early learnings we captured during our back-to-school campaign, where we grew our children's category sales during the most important season of our year.
2023 was a challenging year overall with net sales declining versus the prior year. Customers were cautious during the year, focused on event-driven shopping occasions and the central footwear purchases. With that said, the team successfully grew market share once again this year within the family footwear industry and rapidly advanced our long-term strategic plans. We delivered successful growth events during both back-to-school and holiday, establishing a compelling approach to incite customers to choose our banners when they are ready to purchase in 2024.
We have applied learnings from our go-to-market approach, focused on social, digital marketing and compelling assortments to the 2024 tax refund and early spring season, which I will provide an update on shortly. Gross profit margin in the quarter was 35.6%, representing the 12th consecutive quarter above 35%. Since fiscal 2019, our full year gross profit margin has expanded 570 basis points. Margin over the long term has been a key driver of our profit transformation, driven by our targeted promotional plans, smart buying strategies and growth of our Shoe Perks PRM membership, which grew to over 34 million members at the end of fiscal 2023.
Fourth quarter net income was $15.5 million or $0.57 per diluted share compared to fourth quarter '22 net income of $21.6 million or $0.79 per diluted share. Excluding the Rogan's transaction costs in the fourth quarter, adjusted net income was $0.59 per diluted share and $2.70 per diluted share for fiscal 2023. We continued executing our inventory optimization improvement plan in the quarter and delivered ahead of expectations for the first year of this plan. We reduced inventory levels while sustaining robust gross profit margins and providing a fresh assortment of branded products for our customers. Our inventory coming out of the year is in a good position, and we expect to continue driving additional efficiencies in 2024. Carl will lay out our 2024 inventory optimization targets in a moment.
We're at an all-time high of 429 stores, including the 28 acquired Rogan store locations. By the end of fiscal 2024, we expect to operate 430 to 432 stores, resulting in an increase of 30 to 32 stores this year. The new stores that are expected to open in 2024 will be part of our Shoe Station growth banner, contributing to our expectation of sales growth this year. We also continue to modernize our Shoe Carnival fleet, with approximately 60% now complete and additional stores being modernized during 2024. The annual capital investment required for the modernization program decreases starting this year as the program nears completion.
We continue to have a strategic road map in place to surpass 500 stores in our fleet in 2028. We plan to achieve the store growth objective through organic new store growth and by pursuing additional M&A targets as profitable opportunities arise. Our balance sheet is strong with over $110 million in cash and marketable securities on hand at the end of the year. As compared to the prior year, cash and marketable securities increased nearly $50 million and cash flow from operations increased over $70 million. We continue to fund our strategic investments in the business from operating cash flows, carrying no debt, and we funded the acquisition of Rogan's with cash flow entirely generated in fiscal 2023.
Given the current high interest rate environment, our no debt position puts us in a great place to continue to fund future growth opportunities with cash generated by the business. In March, we raised our quarterly dividend by 12.5% per share. With this recent increase, we have now grown our shareholder dividend by 238% since the first quarter of 2019 and provided 48 consecutive quarterly dividend. And in the last 12 months, we've increased the dividend 35%, demonstrating our confidence in delivering growth and further enhancing shareholder returns over the long term.
In February, we acquired Rogan's, the second acquisition in Shoe Carnival's history for a purchase price of $45 million. Down to the 1971 revenues a 53-year old work and family footwear company with 28 stores in Wisconsin, Minnesota and Illinois. Importantly, this acquisition provides us market leadership in Wisconsin and expands our presence into Minnesota, our 36th state. Rogan's carries over 100 name brands and thousands of styles of footwear for men, women and children and has a customer base that is complementary with our Shoe Station banner.
As previously announced, we have an 18-month plan to integrate Rogan's into our Shoe Station growth banner, which is well underway, and I'm pleased with the progress to date. Rogan's will be immediately accretive to our 2024 results, and we now expect the level of accretion will increase meaningfully in 2025. We had initially planned to realize full synergies of approximately $1.5 million at a level that was relatively balanced over the course of fiscal 2025 and fiscal 2026. But as we announced in our press release this morning, we've now increased the full synergy expectation to $2.5 million. Additionally, we now expect to realize the full synergy amount in fiscal 2025. Based on the early smooth progress of the integration process to date, the strength of the Rogan's business and the opportunities for future growth.
Moving now to our full year 2024 outlook. We expect to drive significant top line growth in 2024, sustained strong gross profit margins, expand our customer base and begin to strategically integrate the Rogan's business. From a net sales perspective, the outlook includes the expectation of net sales growth in 2024, led by the Rogan's acquisition, continued strength in our Shoe Station growth banner, growth in e-commerce and significantly improving sales trends in our Shoe Carnival banner.
Net sales for 2024 are expected to be in the range of $1.21 billion to $1.25 billion, representing growth of approximately 4% to 6%. Worth noting fiscal 2024 includes 52 weeks as compared to 53 weeks in fiscal 2023, representing an approximate 1% headwind to growth in 2024 versus 2023. Comparable store sales are expected to be in a range of down 3% to up 1% versus 2023, representing a significantly improved trend versus prior year, primarily in our Shoe Carnival banner.
Gross profit margin is expected to be approximately even with prior year, reflecting our long-term profit transformation strategy and our sustained gross profit margin performance. SG&A as a percent of net sales is expected to be approximately 40 basis points higher than fiscal 2023. The increase versus prior year is led by 2 primary factors that are important to understand as part of our 2024 outlook. Approximately 20 basis points of the SG&A increase is due to expected purchase accounting, merger and integration costs related to the Rogan's acquisition. Patrick will elaborate shortly.
The balance of the increase versus prior year is driven by Rogan's operating expenses that are expected to be synergized in fiscal 2025 as part of the accelerated integration plan. We do not expect to begin realizing synergies on the Rogan's operating expenses into late 2024. The income tax rate for fiscal 2024 is expected to be approximately 26%, representing an increase of 230 basis points versus prior year and a negative impact to EPS of approximately $0.08. Patrick will provide more details in a few moments.
In summary, our 2024 expectation is for sales growth, gross profit margin that is approximately flat to prior year, increased SG&A in the near term and a tax headwind of approximately $0.08. This translates into adjusted EPS in fiscal 2024 of $2.65 at the midpoint of guidance. Patrick will provide additional details on the 2024 outlook. But in terms of year-to-date performance in early 2024, we are seeing encouraging trends. As I discussed earlier, we're applying the learnings from our successful August back-to-school campaign and December holiday season to win customers' business when they're ready to purchase in 2024. Using our go-to-market approach focused on social and digital marketing and compelling products, we are achieving success during the tax refund and early spring season.
Rogan's Shoe Station and e-commerce sales are growing as expected and Shoe Carnival trends are improving. We're now halfway through Q1, and I can share that we achieved sales growth in the low to mid-single-digit range and sustained gross profit margin performance quarter-to-date. I'm most encouraged with customers' response to our tax refund and spring sandal [ season and ] marketing campaign and the fresh product assortment. Specifically, over the past 3 weeks of running our new digital-first campaign, we've seen our sales accelerate to high single-digit growth with a very strong customer response to our spring seasonal offering across our banners.
In summary, we delivered net sales at the high end of our fourth quarter expectations, led by strong growth during the December holiday period. We delivered profitability in line with our expectations, and our results were consistent with the preliminary results announced last month. Our new plans drove growth during the holiday period and are being activated again successfully in early 2024. We delivered on our inventory optimization improvement plan ahead of target, with inventory levels down, product assortment in a good position with additional efficiencies expected in 2024.
Our balance sheet is strong with no debt for the 19th consecutive year end, we continue to generate solid cash flow, and we have the capacity to fund increased shareholder value and future growth opportunities with cash generated by the business. In February, we completed the Rogan's acquisition and funded the deal with cash flow generated in 2023. We have increased the expected synergy realization of $2.5 million and accelerated the integration plan with the expectation of realizing the full synergies in fiscal 2025.
Rogan's will be accretive to our results in 2024, and the level of accretion is now expected to increase significantly in 2025 as the expected synergies are realized. Our 2024 outlook demonstrates our expectation for net sales growth and sustained profitability performance with the top line growth led by Rogan's, the strength of our Shoe Station banner, growth in e-commerce sales and significantly improving trends in our Shoe Carnival banner.
Before handing it over to Carl, I would like to close with some perspective on our long-term performance. We have experienced solid net sales growth and transformational profitability growth since 2019, led by our acquisition strategy, our investments in CRM and e-commerce modernization as well as our targeted promotional strategies. Since 2019, earnings per share have increased 84%, representing an EPS CAGR of 16%. Over the same period, gross profit margin has expanded 570 basis points and sales have grown 13%.
Our strategy to grow sales and increase profitability over the long term have put us in a strong competitive position to continue growing market share in 2024 and beyond. Our long-term vision is clear: to be the nation's leading family footwear retailer, and I believe we are well positioned to continue advancing toward that ambition in 2024.
And now I'll hand it over to Carl to provide further color on the quarter and our category's performance. Carl?
Carl Scibetta: Thank you, Mark. I would like to begin by setting up the customer backdrop during the quarter. Similar to previous quarters, the families of our customer continues to be cautious with their purchases. Our customers continue to focus on value and they are making more of their footwear purchases during event-driven periods such as the December holiday season this quarter. We saw this customer behavior play out in our results for Q4 and more specifically in our strong performance during the December holiday season.
I'll provide more details on our category performance for the quarter later. But first, I would like to highlight our performance during the holiday season. As Mark discussed, our performance was strong as we built on the learnings from our successful back-to-school performance earlier in the year. Our strategy included a new holiday marketing campaign, which included social, digital and influencer messaging. We rolled out a compelling holiday assortment, providing exceptional value on key products and items that our customers wanted for their holiday gift list and our in-store execution was outstanding. All strategies that we are replicating successfully during tax refund season and early spring, and we will build on these strategies even further for Easter and back-to-school 2024.
Our comp sales for the 2-week holiday period increased mid-single digits, led by total athletics, which were up low teens. Nonathletic also performed well, down only low single digits. Continuing with the December holiday season, we grew total children's low single digit. Our total men's category was flat to slightly up during the holiday period and total women's was down low single digits. Our marketing strategies drove demand. Our merchandise assortment modernize fully staffed stores and easy to shop e-commerce platforms provided the right backdrop for our customers to purchase during the holiday.
Now moving to the quarter. Competitive intensity continues to be high with aggressive promotional activity on seasonal merchandise all the way through January. We delivered gross profit margin above 35% for the 12th consecutive quarter and remain committed to our profit transformation and targeted CRM strategies to continue delivering sustained gross profit margin performance. Our merchandise margin for the quarter decreased by 170 basis points versus prior year, primarily due to increased promotional activity on seasonal merchandise. For a long-term perspective, compared to 4 years ago, in Q4 2019, our merchandise margin has significantly expanded by approximately 750 basis points in the quarter, demonstrating the success of our long-term profit transformation strategy and the ability to leverage our advanced CRM capabilities and analytics to inform our promotional strategies.
During the fourth quarter, we continued to further optimize our inventory levels, and we finished the year ahead of our target. Inventory at the end of the year was lowered by approximately 11% on a dollar basis than prior year. And on a unit basis, total inventory was down 15% versus prior year. Our inventory content is clean, and we continue to manage inventory flow to ensure our stores are stocked with the product offerings that our customers want. As we continue to execute our inventory strategy in 2024, we expect to generate additional efficiencies and further optimize our inventory. Excluding the impact of Rogan's, we expect fiscal 2024 year-end inventory to be approximately $20 million or 5% lower than fiscal 2023 year end, while maintaining the freshest product assortment for our customers.
Now moving to sales and categories for the quarter. Total Q4 comp sales were down 9.4%, which reflected event-driven shopping with lower traffic prior to the December holiday period and disruptions due to weather in January. As I discussed earlier, our December holiday performance was very successful with strong growth in adult athletics as well as children's and demonstrates our ability to meet customers' needs when they are ready to purchase.
In the categories perspective for the quarter, children's comp sales were down mid-single digit with athletic flat and nonathletic down mid-teens. The strong performance of children's athletics was led by basketball [ and court ]. The children's nonathletic performance was primarily softness in boots. Comp sales in both men's and women's adult athletics were down high singles with better performance in November and December, offset by slower performance in January.
Fourth quarter comp sales in women's nonathletic footwear were down low double digit with boots and dress down mid-teens. Sandals were down low teens and sport was down low single digit, and casuals were down mid-teens in the quarter. Men's nonathletic comp sales were down low double digits. Dress was down high teens, boot was down high singles and casuals down low double digits. In casual, the decline in canvas was partially offset by growth in [ slip-on ]. To summarize, our business performed well during the December holiday season, growing sales mid-single digits. Total athletics grew low teens for the holiday period, led by strong performance in adults. During nonevent period, top line performance softened as price-conscious consumers continue to focus their footwear purchasing towards event-driven periods.
Turning now to thoughts on 2024. Our boot inventory is in a good position going into the year down high 20s on a unit basis compared to prior year. As discussed last quarter, with our best-in-class vendor relationships, we are in a good position to be flexible with our boot inventory and manage it effectively within the backdrop of a challenging weather and demand environment. In the quarter, we continued optimizing our inventory and delivered ahead of target. Our inventory content and mix are both in a good position, and we will continue to further execute our inventory optimization improvement plan in 2024. We remain committed to our profit transformation and targeted CRM strategies, and we are excited about the fresh new products that are coming into our stores in early 2024. The flow of seasonal products is much better than prior year, and the newness in athletics is performing well.
We're also very excited about our Rogan's acquisition and opportunities to grow the business as we have successfully done with our Shoe Station banner over the last couple of years. We look forward to pursuing growth in the Upper Midwest with Rogan's and engaging with the customer base that is very complementary to our Shoe Station customer base. And with the learnings from our successful DTF and December holiday performances, we are building further on the marketing strategies to engage with our customers as we are seeing encouraging performance during the tax refund season and early spring.
And with that, I will turn the call over to Patrick for a review of our financials. Patrick?
Patrick Edwards: Thanks, Carl. Moving on to our financial results. Starting with top line, our net sales in Q4 were $280.2 million. This was down 3.6% versus the prior year. Net sales in the quarter were at the high end of our expectations, led by strong performance during the December holiday period and the benefit of the 53rd week in the quarter. On a banner basis, our Shoe Station banner, total sales for Q4 came in at a low teen increase versus the prior year on the strength of new stores and e-commerce sales, and our Shoe Carnival banner total sales came in at a mid-single-digit decline for the quarter.
On a comparable store basis, which excludes the impact of the extra week in new store growth, company-wide sales were down 9.4% for fourth quarter and in line with our expectations. The lower sales were primarily driven by soft trends prior to the December holiday peak period and impacts from weather disruption, resulting in store closures for a couple of weeks across multiple geographies in January. As Mark and Carl discussed, our results during the peak December holiday period were strong with mid-single-digit comparable sales growth, led by athletics.
Q4 gross profit margin was 35.6%, marking the 12th consecutive quarter that our gross profit margin has exceeded 35%. Compared to Q4 2022 gross profit margin was down 270 basis points, with merchandise margins decreasing 170 basis points, reflecting increased promotions on seasonal merchandise during the quarter. Buying distribution and occupancy costs were higher in the quarter, primarily due to increased rent associated with operating more stores, partially offset by lower freight and distribution costs. In the quarter, BD&O deleveraged 100 basis points on the lower sales.
SG&A expense in Q4 was $79.7 million, representing a decrease of $2.9 million versus Q4 2022. Q4 SG&A included approximately $800,000 in transaction costs related to the Rogan's acquisition and otherwise decline on lower selling expenses in the quarter. On a GAAP basis, our net income for fourth quarter 2023 was $15.5 million or $0.57 per diluted share. On a non-GAAP basis, excluding the Rogan's related transaction costs, adjusted net income for fourth quarter was $16.1 million or $0.59 per diluted share.
Net sales for full year 2023 were $1.176 billion. This was down 6.8% versus prior year and down 8.8% on a comparable store basis. For full year 2023, net income on a GAAP basis totaled $73.3 million or $2.68 per diluted share, and net income on a non-GAAP basis totaled $74 million or $2.70 per diluted share at the midpoint of our guidance. Taking a long-term perspective, it's worth reemphasizing that over the last 4 years ending with fiscal 2023, we have delivered a 16% EPS CAGR, led by gross profit margin expansion of 570 basis points and net sales growth of 13% since 2019.
To further support shareholder value in March, we raised our dividend by 12.5% to $0.135 per share, representing an increased annualized dividend rate of $0.54 per share. We have now provided a dividend for 48 consecutive quarters, and this is the 10th consecutive year we have increased that dividend. During the quarter, we didn't repurchase any shares and have $50 million available under our current share repurchase program. At the end of 2023, we had total cash, cash equivalents and marketable securities of approximately $110 million. Cash and cash equivalents increased over $47 million versus 2023 and full year 2023 cash flow from operations increased over $72 million versus full year 2022.
Now moving on to the 2024 outlook, which builds on our long-term sales growth and profit transformation led by our acquisition strategy, higher e-commerce sales and sustained gross profit margin performance. The outlook for fiscal 2024 net sales demonstrates our expectation for growth, led by our recent Rogan's acquisition, continued strength in our Shoe Station banner, growth from e-commerce sales, combined with the expectation of improving trends at our Shoe Carnival banner.
Net sales are expected to be in a range of $1.21 billion to $1.25 billion, representing growth of 4% to 6%. Comparable store sales are expected to be in a range of down 3% to up 1% versus fiscal 2023, representing an improving trend versus the prior year, primarily driven by our Shoe Carnival banner. Gross profit margin is expected to be approximately even with fiscal 2023, reflecting our advanced CRM capabilities and targeted promotional strategies that are expected to sustain gross profit margin performance.
SG&A as a percent of net sales is expected to be approximately 40 basis points higher than fiscal 2023. Approximately 20 basis points of that increase is due to expected purchase accounting, transaction and integration costs related to the Rogan's acquisition, and the remaining balance of the increase is primarily due to the approximate $2.5 million of operating expenses that are expected to be synergized in fiscal 2025 as part of our integration of Rogan's.
As Mark discussed, we are encouraged by the integration process to date and have increased the expected synergies related to Rogan's from $1.5 million to $2.5 million and expect them to be realized in full in fiscal 2025. We now see increased opportunities for synergies in such areas as e-commerce operations as well as leveraging our scale in supply chain, buying and in back-office SG&A areas, such as duplicative services, insurance, technology providers to capture those cost efficiencies.
We do not expect to begin realizing any meaningful synergies until late 2024. As previously announced, in fiscal 2024, we expect Rogan's to generate approximately $84 million in net sales, and it will be accretive to our results in 2024. After full synergies are realized, we now expect Rogan's to generate approximately $11 million in operating income in 2025.
Our tax rate for fiscal 2024 is expected to be approximately 26%, representing an increase of 230 basis points versus fiscal 2023 and a negative impact to EPS of approximately $0.08. This higher rate primarily reflects the expectation of a lower benefit in fiscal 2024 from share settled equity awards and prior year state deferred tax benefits that are not expected to recur in fiscal 2024.
For fiscal 2024, GAAP EPS is expected to be in a range of $2.50 to $2.70 per share, inclusive of the $0.08 tax headwind, a standard 52 weeks of net sales, which is an approximately $15 million negative impact to net sales and the expectation of approximately $2 million of Rogan's related purchase accounting, transaction and integration costs. Non-GAAP EPS, which excludes those expected purchase accounting, transaction and integration costs related to the Rogan's acquisition, is expected to be in a range of $2.55 to $2.75, representing a midpoint of $2.65.
As part of our continuing inventory optimization improvement plan, we expect inventory, excluding the impacts from the Rogan's acquisition at the end of fiscal 2024 to be lower by approximately $20 million or 5% versus fiscal 2023 year-end, which will put our Shoe Carnival banner inventory at the end of fiscal 2024, in line with inventory levels at the end of fiscal 2019, while maintaining the best assortment of products for our customers.
Total capital expenditures are expected to be in the range of $25 million to $35 million in fiscal 2024 and lower than the prior year as our Shoe Carnival fleet modernization program nears completion. In our 2024 outlook, we have taken into consideration the dynamic customer purchasing trends and behaviors such as event-driven shopping and the purchase of essential footwear. Current trends are encouraging as sandal merchandise is selling better than last year. We will gain additional insights about nonpeak consumer sentiment after Easter and before going into back-to-school.
Also, I would like to point out a couple of key phasing considerations in our fiscal 2024 versus the prior year. Fiscal 2023 included the 53rd week that will not recur in 2024, impacting fourth quarter net sales comparison to 2023 by approximately $15 million. And as a result of the 53rd week in fiscal 2023, the calendar weeks in each quarter will shift. This shift will be meaningful in the second quarter and third quarters of 2024.
Our highest volume back-to-school sales week will shift from Q3 in the prior year and will be included in our Q2 results for fiscal 2024. The impact of this shift will be approximately $25 million and result in expected growth in Q2 2024 and a decline versus the prior year in Q3 2024. Despite the shift, the combined total of Q2 and Q3 sales growth in 2024 versus the prior year is expected to be in line with our full year outlook of 4% to 6% net sales growth.
With regard to the first quarter 2024, as Mark discussed, we have achieved low to mid-single digit net sales growth to date driven by our spring seasonal and tax refund marketing campaign. Our current campaign, modernized stores and product assortment is currently driving and capturing demand. Overall, for Q1 2024, we expect sales growth to remain in that low to mid-single-digit range. And consistent with our annual 2024 outlook, we expect to sustain gross profit margin, higher operating expenses and a higher tax rate in the first quarter of 2024 compared to last year. Our top line growth is therefore expected to result in first quarter EPS that is approximately flat compared to the $0.60 per share earned in the first quarter of 2023.
Our balance sheet is strong and our cash flow is steady, which positions us to fund internal growth, execute on M&A opportunities and most importantly, the continued ability to deliver long-term shareholder return. We also announced today that April 24, 2024, has been set as the shareholder of record date for our Annual Shareholders' Meeting. That meeting will be held on June 25, 2024.
This concludes our financial review. Now we would like to open the call up for questions. Operator?
Operator: [Operator Instructions] Your first question comes from the line of Mitch Kummetz with Seaport Research.
Mitchel Kummetz: Yes. My first question has to do with the first quarter. I appreciate all the commentary around quarter-to-date sales and 1Q sales guidance. But given the acquisition of Rogan's, sales is apples to apples, can you say what the comp is quarter-to-date? And what comp is embedded in your Q1 guide? And then also on 1Q. You talked a little bit about the impact of weather and kind of how you see that going forward to the extent that maybe there's a little bit more cold weather coming? And then I do have a follow-up.
Mark Worden: Mitch, it's Mark. So let me start with your sales growth for Q1 is achieved right in that low single-digit range. We're very encouraged. We started the spring campaign and [ tax miss ] campaign 3 weeks ago, activating the learnings from holiday and BTS and it's working very well. [ Well, for ] the last 3 weeks for the company have accelerated quickly. And specifically, we're in the high single-digit sales growth range for the 3 weeks since the campaign started, and it's accelerating even faster as we look into March as that weather turns favorable for spring sandal season.
We're not disaggregating comps at this point, but I can give you a broad comment. All banners are growing in March. And we're very pleased with the strong growth acceleration in Shoe Station. Our e-commerce is accelerating like we had expected in our guidance. Rogan's is delivering, where we had hoped for our guidance. And I think everyone wants to hear what we're most pleased with, Shoe Carnival is accelerating rapidly. Shoe Carnival is also growing for the month of March, and we're seeing strong results in the campaign. So while we're not going to break out comps per se on a banner level, I hope that helps give commentary. Every part of the business is responding fast, favorably and in growth as we get into this campaign season.
Regards to weather, we're confident in March. I mean we can't predict if we get a crazy snowstorm in the Upper Midwest, but our comps are easier in the March, April time frame versus a very challenging disappointing spring season last year. We expect March to be strong. As I said, we continue to accelerate sales in the high singles for the 3 weeks of the campaign and it's accelerated from there if I just look at the month of March. So we feel very confident in March.
What will -- I think an important topic for all and I'll address it right now. What has given us a broad range in our comp from a down [ 3 to a plus 1 ]. We're still not clear yet if the consumer is going to be cautious as we get past the Easter early spring holiday season and the event period and until we get to back-to-school. So we have a wide range there, particularly on the Shoe Carnival banner as -- until we see how the consumer responds after this event, what will that look like. And that's really the 4-point range and that range is largely in Shoe Carnival.
Mitchel Kummetz: That's helpful, Mark. And then my follow-up, maybe for Carl. Could you speak to the product pipeline in 2024? I think you made the comment that you're seeing a nice improvement in the athletic business. It sounds like sandals are off to a good start again. I don't know how much of that is weather versus the assortment? And then maybe talk a little bit about how you're thinking about boots in the back half, lapping some pretty poor performance this year. I don't know if you see that as an opportunity or if that's a category that you still want to be cautious around.
Carl Scibetta: Mitch, we are -- in the athletic world, we have a nice flow of product coming in. We're receiving goods, new fresh products on time, in fact, early in some cases, and we're seeing some nice performance out of new categories or retro categories that our consumer is now watching on to.
From a sandal standpoint, certainly, weather has helped early, but several categories have emerged quite well in that area, and we're pleased with what we're seeing there. And most definitely, my flow of product into the stores on a sandal perspective is much better than it was a year ago. It was not a little choppier a year ago with supply chain issues where that's all cleaned up and products are coming in as expected or early and flowing out nicely.
Regarding boots, we're still cautious on boots. We need to see some freshness there, enough freshness that we feel will drive incremental boot sales over a year ago. So we're taking a cautious approach to that like we have in the past. We'll partner with our major boot vendors to make sure that there's supply if needed. But then there's also -- we also have an ability to move if we need to if we're not seeing performance. So we'll play boots next year the way we play in this year.
Operator: Our next question comes from the line of Jim Chartier with Monness, Crespi & Hardt.
James Chartier: There's a lower income consumer [indiscernible] the struggle for you, I believe, from most of last year, given kind of [ quarter delayed ] trends, can you decide whether kind of the improvement in the lower income versus higher income consumer Shoe Carnival banner?
Mark Worden: Jim, it's Mark. First spring, we're seeing improvement across banners and across demographics. It's very encouraging. And the 2 things that are absolutely working across low income or high income, urban and suburban are the new approach to our marketing campaign. It's -- we're really surrounding people the social, digital and influencer and it's resonating quickly with Carl's fantastic slate of brands and new fresh value for providing -- working great across banners.
The big question again and again, the range for our guidance, and we're still cautious is once we get past the spring season events, that's going to be the big learning we're going to have as we get into April and May, and we can provide more color when we get into reporting Q1 during May of what did it look like post event shopping for the lower-income consumer. But right now, everything is resonating strong growth across all banners are feeling really good about winning share with our plans during event season, we're waiting to learn and we have caution of what it's going to look like for nonevent season still.
James Chartier: And then within the marketing, given the [ response we're seeing ], is there opportunity to do more within marketing for back-to-school and holiday based on what you've seen so far?
Mark Worden: Absolutely. Yes, absolutely. We're planning to replicate and increase for back-to-school. We had a good kids growth business in 2023. We plan to activate these plans and grow our ambition is not just kids growth, but we intend to grow back-to-school this year for the whole business is our goal. And holiday, we spoke [ at late minutes ]. We had a very good holiday season this year. We can do more because we were still testing and learning what did work, and so we can invest more for this upcoming holiday if it continues to work in back-to-school.
So again, we have high confidence, our approach is working on event periods, and will be replicated and activated aggressively. We'll learn if that approach works in nonevent seasons. And if that does work, then we'll be able to provide an update in May on that progress.
James Chartier: Great. And then on inventory levels, you talked about [ reduced inventory ] further this year. Any specific categories where you feel like the inventory is still a little too high or which categories are you focused on reducing levels?
Carl Scibetta: Well, Jim, it's Carl. We'll continue to drive inventory levels down at the end of the season on seasonal products to make sure we come out even cleaner than we have in the past. We're quite pleased where we came in this year in boots, inventories down about 30%. We think there's still some opportunity there, to continue to drive that business down -- I'm sorry, that was ending down. And then really, we are looking at all areas and we anticipate inventory improvements across the board, not that we have any particular area that is -- has an extremely high inventory level. It's pretty consistent across the company, but we think we can get efficiencies in all areas of the business.
Operator: Next question comes from the line of Sam Poser with Williams Trading.
Samuel Poser: I'm just wondering if you could give me some color on the store traffic that you saw in the fourth quarter, especially at Shoe Carnival and then sort of how -- what you're seeing now versus what -- how all these sales are being driven and what you're doing to drive more people or if you need to the Shoe Carnival store specifically? Because it sounds like your Shoe Station traffic [ is very decent ].
Patrick Edwards: Sam, it's Patrick. With respect to the fourth quarter, it's [ not uncommon ] for our traffic pattern and match our comparable store sales, which were down 9.4%. Our overall traffic was in that same range of down 9% throughout the fourth quarter. With respect to going forward now, similarly, not surprising that our sales are up low to mid-single digits. Our traffic is also sort of trending in that same way.
Samuel Poser: Okay. And then Carl, you talked about -- I've got a double question here. Carl, you talked about athletic being strong in that, I guess, [ in that ] period. And it sounds like athletic you're still happy with it. Can you talk about what kind of things are working in athletic? And then separately, as you look at -- you talk about inventory, can you talk about sort of how you think about like narrowing -- maybe narrowing the mix going deeper on key items. You've always done that? And give us some idea how that might look versus 2023 sort of as we move through 2024.
Carl Scibetta: Sure, Sam. On the athletic side, we're starting to see the customer respond to newness and freshness today, [ retro jogger ] kinds of products, the whole soccer category are really taking off with our consumer throughout the fourth quarter and until today, our business with court, our business with basketball and our business with performance running in our Shoe Station business continue to be very, very strong. But athletic right now is about newness and freshness and new categories. And our customers beginning to jump into those new sort of emerging new old categories that have come out.
From a standpoint of inventory, sure we most definitely will continue to edit assortments, drive key items. We have a reliable flow of product coming in right now, and we feel that there's great opportunity to continue to drive key items. That's what we do very, very well. So we feel we're back to somewhat of a normal. We are back to a normal cycle. Our vendors are back to a normal cycle, and we will certainly move into what I believe, an exciting time from a product standpoint, driving key important items and brands.
Samuel Poser: And then one last thing just about the -- this timing shift. The -- it appears to me that you probably expect the comps to improve through the year. But because of the way you have the weeks comparing, again, back to this Q2, Q3 situation. Can you give us sort of how this works by quarter, like what the -- you said $25 million, I think, in Q3 was shifting to Q2, but you lose a small week at the beginning of Q2 and you gain a big week at the end. How does that affect Q1, Q2, Q3, and you lose, I guess, $15 million in Q4. But can you sort of walk through that and give us each quarter with how to think about just the dollar shift in and out of each quarter?
Patrick Edwards: Sam, this is Patrick. You're correct. The meaningful impacts to be focused on is this large week that we have that moves out of Q3 and into Q2. That's the $25 million net week, not a gross weak, but that's the net amount that moves between the shifting of what moves in and what moves out. And then the $15 million that we lose in Q4 compared to 2023, those are the 2 meaningful elements of it in the quarterly shifts. Again, over both of those periods of time between Q2 and Q3, we would expect our sales growth to level out to that 4% to 6% growth rate that we have for the overall year. In Q4, that growth rate will be lower because we're losing that $15 million.
Samuel Poser: Right. I understand. But what I'm saying is that in Q2, so you're gaining a week that's bigger than $25 million, and then you're losing a week that's much smaller than that. And you're getting a -- you're netting that, but you're gaining like [ $30 million and then losing $5 million ] or whatever it is. Can you give us the plus and minus for each quarter? It would just really help being able to...
Patrick Edwards: Sure. So I'll try it again in a different way. The impact on Q1 is not meaningful. The impact on Q2 will be plus $25 million, and the impact on Q3 will be minus $25 million. And then Q4 is roughly down $15 million.
Operator: Another question comes from the line of Mitch Kummetz with Seaport Research.
Mitchel Kummetz: When I ask Sam's last question maybe a little bit differently. I want to focus on the EBIT. So starting with the 53rd week this -- in 2023, Patrick, you mentioned that was about $15 million in sales. What was the impact on EBIT? And then that 2Q, 3Q $25 million shift you're referencing, how does that sort of flow through to EBIT? Like how much EBIT is shifting from 3Q to 2Q?
Patrick Edwards: Mitch, it's a great question. Our point of view on that, generally speaking, is each one of those sales dollars is roughly about $10 million -- or excuse me, is about 10% of operating income. So $15 million, $1.5 million-ish, something like that on operating income on -- before you get -- sorry, before you get down to operating income, it's probably going to be bigger than that. It's probably somewhere around half that number. So the $15 million is principally somewhere around half of that without any other effects.
Mitchel Kummetz: I guess I didn't quite follow that. Because you said $1 million is about 10% and then you said something about half I didn't...
Patrick Edwards: Sorry. Sorry, Mitch. Let me get your question again. It's down to an EBIT number. So it's 8% to 10% of the number. Like I said before, on operating income. Whenever we're pulling down to -- from revenues down to EBIT, it's about 8% to 10%.
Mitchel Kummetz: Okay. And then on 2024, you mentioned that gross margin will be sort of flattish year-over-year. How does that sort of break out between merch margin and BD&O? I'm assuming maybe especially kind of given the comp level that those are probably sort of flattish as well? Is that how you're thinking about it?
Patrick Edwards: Mitch, that's another good question. I can start to give -- provide a little bit of color and then have Mark pull back in a little bit. But with respect to our overall gross profit margin, we do see the capabilities of keeping this above 35% thing running for the entire year. We still need a little bit more clarity on the Rogan's acquisition and whether or not those stores will have some bit of impact. And as we move them into our process and our ability and into our distribution and supply chain. But overall, we see a margin that a gross profit margin that will stick and be even to the current year.
I would say with respect to merchandise margin and our product margins associated with that, we still see strong product margins continuing into the current year, and those product margins is what drives our overall merchandise margin. So those will be flat. And then the concept of BD&O is also expected to be flat, but hopefully improving a little bit as we leverage some stores over some sales growth.
Mitchel Kummetz: Okay. And then one last one for me. Just on the SG&A, it sounds like from a marketing standpoint, you guys seem to be seeing a lot of success with the new campaign. It sounds like you're not really -- for 2024, it doesn't sound like you're expecting to spend more from a percentage standpoint. You're just expecting to spend sort of better in terms of kind of how and when you're flowing those marketing dollars. Could you maybe just sort of elaborate on that?
Mark Worden: This is Mark. Spot on Mitch. We tested and learned a significant shift out of traditional marketing vehicles like television, like print during BTS and then again, during holiday and into more effective targeted vehicles like digital, like social, like influencer. It worked as we shared, and we're going to do that again this year, having a significantly reduced investment in those traditional mediums that frankly weren't giving us great return and work delivering great traffic for us last year and shifting our funding to far more efficient, profitable tactics like I just mentioned.
If we see it working in nonpeak seasons, we'll increase advertising investments and talk more about that in pursuant quarters if we decide to take SG&A higher if it's getting a strong return on ad spend. But right now, we've got the events loaded effectively and I think for a really good shape.
Operator: At this time, there are no other questions. So I will hand the call back over to management for closing remarks.
Steve Alexander: Thanks again for joining today's call. This is Steve. I'm around all day. So [ if you'd ] like to talk, please reach out to me. Thank you very much.
Operator: Ladies and gentlemen, this concludes today's conference call. You may now disconnect.
Subscribe now to gain full access to the earnings summary, 5 years analyst estimates and more exclusive content.
Subscribe NowWARNING: AI-generated summary.
While this is a phenomenal tool that can save you time and provide meaningful insights and key takeaways from the earnings call, it may contain inaccuracies or misinterpretations. For precise information, please refer to the original transcript.
(* All numbers are in thousands)
Fiscal Year | 2014 | 2015 | 2016 | 2017 | 2018 | 2019 | 2020 | 2021 | 2022 | 2023 |
---|---|---|---|---|---|---|---|---|---|---|
Revenue | 940,162 | 983,968 | 1,001,102 | 1,019,154 | 1,029,650 | 1,036,551 | 976,765 | 1,330,394 | 1,262,235 | 1,175,882 |
Cost Of Revenue | 666,483 | 693,452 | 711,867 | 722,885 | 720,658 | 724,682 | 696,783 | 803,607 | 794,071 | 754,116 |
Gross Profit | 273,679 | 290,516 | 289,235 | 296,269 | 308,992 | 311,869 | 279,982 | 526,787 | 468,164 | 421,766 |
Research And Development Expenses | 0 | 0 | 0 | 0 | 0 | 0 | 0 | 0 | 0 | 0 |
General And Administrative Expenses | 190,226 | 201,783 | 208,423 | 218,468 | 218,032 | 217,660 | 216,017 | 260,433 | 265,820 | 269,885 |
Selling And Marketing Expenses | 41,600 | 42,100 | 42,900 | 40,100 | 41,200 | 40,000 | 42,100 | 58,700 | 55,900 | 56,300 |
Selling General And Administrative Expenses | 231,826 | 243,883 | 251,323 | 258,568 | 259,232 | 257,660 | 258,117 | 319,133 | 321,720 | 326,185 |
Other Expenses | 0 | 0 | -3,400 | 0 | 0 | 0 | 0 | 0 | 0 | 0 |
Operating Expenses | 231,826 | 243,883 | 251,323 | 258,568 | 259,232 | 257,660 | 258,117 | 319,133 | 321,720 | 326,185 |
Cost And Expenses | 898,309 | 937,335 | 963,190 | 981,453 | 979,890 | 982,342 | 954,900 | 1,122,740 | 1,115,791 | 1,080,301 |
Interest Income | 14 | 39 | 6 | 4 | 747 | 730 | 97 | 24 | 972 | 2,917 |
Interest Expense | 165 | 168 | 169 | 292 | 150 | 191 | 412 | 478 | 294 | 282 |
Depreciation And Amortization | 20,063 | 23,078 | 23,699 | 23,804 | 21,843 | 59,272 | 58,122 | 61,763 | 70,962 | 28,794 |
EBITDA | 61,930 | 69,750 | 61,617 | 61,509 | 72,350 | 71,889 | 38,076 | 226,430 | 170,612 | 124,375 |
Operating Income | 41,853 | 46,633 | 37,912 | 37,701 | 49,760 | 54,209 | 21,865 | 207,654 | 146,444 | 95,581 |
Total Other Income Expenses Net | -151 | -129 | -163 | -288 | 597 | 539 | -315 | -454 | 678 | 559 |
income Before Tax | 41,702 | 46,504 | 37,749 | 37,413 | 50,357 | 54,748 | 21,550 | 207,200 | 147,122 | 96,140 |
Income Tax Expense | 16,175 | 17,737 | 14,232 | 18,480 | 12,222 | 11,834 | 5,559 | 52,319 | 37,054 | 22,792 |
Net Income | 25,527 | 28,767 | 23,517 | 18,933 | 38,135 | 42,914 | 15,991 | 154,881 | 110,068 | 73,348 |
Eps | 0.640 | 0.730 | 0.640 | 0.570 | 1.260 | 1.490 | 0.570 | 5.490 | 4 | 2.690 |
Eps Diluted | 0.640 | 0.730 | 0.640 | 0.570 | 1.230 | 1.460 | 0.560 | 5.420 | 3.960 | 2.680 |
Weighted Average Shares Outstanding | 39,554 | 38,834 | 36,034 | 32,440 | 30,222 | 28,854 | 28,132 | 28,233 | 27,543 | 27,231 |
Weighted Average Shares Outstanding Diluted | 39,582 | 38,854 | 36,044 | 32,454 | 30,998 | 29,372 | 28,496 | 28,596 | 27,812 | 27,407 |
Currency | USD | USD | USD | USD | USD | USD | USD | USD | USD | USD |
(* All numbers are in thousands)
Fiscal Year | 2014 | 2015 | 2016 | 2017 | 2018 | 2019 | 2020 | 2021 | 2022 | 2023 |
---|---|---|---|---|---|---|---|---|---|---|
Cash And Cash Equivalents | 61,376 | 68,814 | 62,944 | 48,254 | 67,021 | 61,899 | 106,532 | 117,443 | 51,372 | 99,000 |
Short Term Investments | 0 | 0 | 0 | 0 | 0 | 0 | 0 | 14,961 | 11,601 | 12,247 |
Cash And Short Term Investments | 61,376 | 68,814 | 62,944 | 48,254 | 67,021 | 61,899 | 106,532 | 132,404 | 62,973 | 111,247 |
Net Receivables | 2,928 | 2,131 | 4,424 | 6,270 | 1,219 | 2,724 | 7,096 | 14,159 | 3,052 | 2,593 |
Inventory | 287,877 | 292,878 | 279,646 | 260,500 | 257,539 | 259,495 | 233,266 | 285,205 | 390,390 | 346,442 |
Other Current Assets | 5,991 | 5,193 | 4,737 | 5,562 | 11,534 | 5,529 | 8,411 | 10,264 | 13,308 | 21,056 |
Total Current Assets | 359,129 | 370,077 | 351,751 | 320,586 | 337,313 | 329,647 | 355,305 | 442,032 | 469,723 | 481,338 |
Property Plant Equipment Net | 101,294 | 103,386 | 96,216 | 86,276 | 70,605 | 282,788 | 267,964 | 309,485 | 460,047 | 502,464 |
Goodwill | 0 | 0 | 0 | 0 | 0 | 0 | 0 | 11,384 | 12,023 | 12,023 |
Intangible Assets | 0 | 0 | 0 | 0 | 0 | 0 | 11,200 | 32,600 | 32,600 | 32,600 |
Goodwill And Intangible Assets | 0 | 0 | 0 | 0 | 0 | 0 | 11,200 | 43,984 | 44,623 | 44,623 |
Long Term Investments | 0 | 0 | 0 | 0 | 0 | 0 | -11,200 | 0 | 0 | -17,341 |
Tax Assets | 4,227 | 7,158 | 9,600 | 8,182 | 9,622 | 7,833 | 5,635 | 2,699 | 11,844 | 92,718 |
Other Non Current Assets | 366 | 472 | 911 | 536 | 459 | 8,106 | 13,843 | 14,064 | 3,544 | 30,941 |
Total Non Current Assets | 105,887 | 111,016 | 106,727 | 94,994 | 80,686 | 298,727 | 287,442 | 370,232 | 520,058 | 653,405 |
Other Assets | 0 | 0 | 0 | 0 | 0 | 0 | 0 | 0 | 0 | 0 |
Total Assets | 465,016 | 481,093 | 458,478 | 415,580 | 417,999 | 628,374 | 642,747 | 812,264 | 989,781 | 1,134,743 |
Account Payables | 67,999 | 72,086 | 67,808 | 41,739 | 48,715 | 60,665 | 57,717 | 69,092 | 78,850 | 58,274 |
Short Term Debt | 0 | 0 | -2,355 | -2,382 | -1,558 | 43,146 | 48,794 | 51,563 | 58,154 | 52,981 |
Tax Payables | 0 | 1,902 | 1,362 | 1,797 | 2,131 | 2,317 | 3,172 | 2,270 | 2,416 | 2,344 |
Deferred Revenue | 0 | 0 | 2,355 | 2,382 | 1,558 | 14,240 | 17,839 | 2,323 | 2,399 | 2,371 |
Other Current Liabilities | 15,123 | 15,848 | 18,488 | 15,045 | 22,069 | 4,455 | 6,551 | 30,730 | 17,882 | 14,249 |
Total Current Liabilities | 83,122 | 87,934 | 86,296 | 56,784 | 70,784 | 122,506 | 130,901 | 153,708 | 157,285 | 127,875 |
Long Term Debt | 0 | 0 | 0 | 0 | 0 | 194,108 | 182,622 | 194,788 | 285,074 | 301,355 |
Deferred Revenue Non Current | 0 | 31,971 | 30,751 | 29,024 | 22,171 | -56,928 | -57,096 | -59,399 | 0 | 0 |
Deferred Tax Liabilities Non Current | 0 | 0 | 0 | 0 | 0 | 56,928 | 57,096 | 59,399 | 11,844 | 110,059 |
Other Non Current Liabilities | 50,696 | 21,386 | 22,549 | 22,470 | 20,611 | 14,397 | 19,048 | 11,235 | 10,010 | 12,065 |
Total Non Current Liabilities | 50,696 | 53,357 | 53,300 | 51,494 | 42,782 | 208,505 | 201,670 | 206,023 | 306,928 | 423,479 |
Other Liabilities | 0 | 0 | 0 | 0 | 0 | 0 | 0 | 0 | 0 | 0 |
Capital Lease Obligations | 0 | 0 | 0 | 0 | 0 | 237,254 | 231,416 | 246,351 | 343,228 | 301,355 |
Total Liabilities | 133,818 | 141,291 | 139,596 | 108,278 | 113,566 | 331,011 | 332,571 | 359,731 | 464,213 | 551,354 |
Preferred Stock | 0 | 0 | 0 | 0 | 0 | 0 | 0 | 0 | 0 | 0 |
Common Stock | 207 | 206 | 206 | 205 | 205 | 205 | 205 | 410 | 410 | 410 |
Retained Earnings | 270,686 | 294,308 | 312,641 | 326,738 | 360,443 | 395,761 | 406,655 | 553,487 | 653,450 | 714,647 |
Accumulated Other Comprehensive Income Loss | -139,187 | -150,175 | -168,962 | -180,535 | -196,815 | 0 | 0 | 0 | 0 | 0 |
Other Total Stockholders Equity | 199,492 | 195,463 | 174,997 | 160,894 | 140,600 | -98,603 | -96,684 | -101,364 | -128,292 | -131,668 |
Total Stockholders Equity | 331,198 | 339,802 | 318,882 | 307,302 | 304,433 | 297,363 | 310,176 | 452,533 | 525,568 | 583,389 |
Total Equity | 331,198 | 339,802 | 318,882 | 307,302 | 304,433 | 297,363 | 310,176 | 452,533 | 525,568 | 583,389 |
Total Liabilities And Stockholders Equity | 465,016 | 481,093 | 458,478 | 415,580 | 417,999 | 628,374 | 642,747 | 812,264 | 989,781 | 1,134,743 |
Minority Interest | 0 | 0 | 0 | 0 | 0 | 0 | 0 | 0 | 0 | 0 |
Total Liabilities And Total Equity | 465,016 | 481,093 | 458,478 | 415,580 | 417,999 | 628,374 | 642,747 | 812,264 | 989,781 | 1,134,743 |
Total Investments | 0 | 0 | 0 | 0 | 0 | 0 | -11,200 | 14,961 | 11,601 | 12,247 |
Total Debt | 0 | 0 | 0 | 0 | 0 | 237,254 | 231,416 | 246,351 | 343,228 | 354,336 |
Net Debt | -61,376 | -68,814 | -62,944 | -48,254 | -67,021 | 175,355 | 124,884 | 128,908 | 291,856 | 255,336 |
Currency | USD | USD | USD | USD | USD | USD | USD | USD | USD | USD |
(* All numbers are in thousands)
Fiscal Year | 2014 | 2015 | 2016 | 2017 | 2018 | 2019 | 2020 | 2021 | 2022 | 2023 |
---|---|---|---|---|---|---|---|---|---|---|
Net Income | 25,527 | 28,767 | 23,517 | 18,933 | 38,135 | 42,914 | 15,991 | 154,881 | 110,068 | 73,348 |
Depreciation And Amortization | 20,063 | 23,078 | 23,699 | 23,804 | 21,843 | 16,950 | 16,114 | 18,752 | 23,196 | 28,794 |
Deferred Income Tax | -550 | -3,035 | -1,381 | 1,418 | -1,440 | 2,619 | 2,198 | 2,936 | 14,543 | 5,497 |
Stock Based Compensation | 1,064 | 3,702 | 3,822 | 5,017 | 10,162 | 6,486 | 3,883 | 5,531 | 5,434 | 4,887 |
Change In Working Capital | 3,209 | 2,840 | 10,132 | -12,160 | 14,721 | -47,084 | -21,641 | -83,188 | -151,030 | -45,626 |
Accounts Receivables | 1,409 | 588 | -2,293 | -951 | 3,905 | -1,505 | -4,372 | -6,196 | 11,410 | 459 |
Inventory | -3,076 | -5,001 | 13,232 | 19,146 | 2,961 | -1,956 | 26,229 | -24,281 | -106,192 | 43,948 |
Accounts Payables | 6,838 | 6,530 | -982 | -30,132 | 12,688 | -36,465 | -35,967 | 3,781 | 925 | -22,214 |
Other Working Capital | -1,962 | 723 | 175 | -223 | -4,833 | -7,158 | -7,531 | -56,492 | -57,173 | -67,819 |
Other Non Cash Items | 8,341 | 3,203 | 4,000 | 3,336 | -9,280 | 45,061 | 46,850 | 48,981 | 48,227 | 55,856 |
Net Cash Provided By Operating Activities | 57,654 | 58,555 | 63,789 | 40,348 | 74,141 | 66,946 | 63,395 | 147,893 | 50,438 | 122,756 |
Investments In Property Plant And Equipment | -33,543 | -27,901 | -21,832 | -19,653 | -7,413 | -18,501 | -12,396 | -31,387 | -77,293 | -56,281 |
Acquisitions Net | 0 | 0 | 0 | 0 | 0 | 0 | 0 | -70,685 | 385 | -1,447 |
Purchases Of Investments | 0 | 0 | 0 | 0 | 0 | 0 | 0 | -18,975 | -976 | -403 |
Sales Maturities Of Investments | 0 | 0 | 0 | 0 | 0 | 750 | 303 | 1,800 | 3,850 | 2,045 |
Other Investing Activites | 1,086 | 250 | 0 | 0 | 2,998 | 750 | 303 | 1,800 | 2,874 | 1,447 |
Net Cash Used For Investing Activites | -32,457 | -27,651 | -21,832 | -19,653 | -4,415 | -17,751 | -12,093 | -119,247 | -74,034 | -54,639 |
Debt Repayment | -55 | 0 | 0 | -88,600 | 0 | -20,000 | -24,903 | 0 | 0 | 0 |
Common Stock Issued | 287 | 391 | 223 | 259 | 177 | 182 | 195 | 160 | 187 | 183 |
Common Stock Repurchased | -7,533 | -18,824 | -42,604 | -29,798 | -46,046 | -37,768 | -1,736 | -7,147 | -30,515 | -5,445 |
Dividends Paid | -4,828 | -5,037 | -5,028 | -4,819 | -4,763 | -5,671 | -5,128 | -7,998 | -9,972 | -12,190 |
Other Financing Activites | 55 | 4 | -418 | 87,573 | -327 | 8,940 | 195 | -2,750 | -2,175 | -3,037 |
Net Cash Used Provided By Financing Activities | -12,074 | -23,466 | -47,827 | -35,385 | -50,959 | -54,317 | -6,669 | -17,735 | -42,475 | -20,489 |
Effect Of Forex Changes On Cash | 0 | 0 | 0 | 0 | 0 | 0 | 0 | 0 | 0 | 0 |
Net Change In Cash | 13,123 | 7,438 | -5,870 | -14,690 | 18,767 | -5,122 | 44,633 | 10,911 | -66,071 | 47,628 |
Cash At End Of Period | 61,376 | 68,814 | 62,944 | 48,254 | 67,021 | 61,899 | 106,532 | 117,443 | 51,372 | 99,000 |
Cash At Beginning Of Period | 48,253 | 61,376 | 68,814 | 62,944 | 48,254 | 67,021 | 61,899 | 106,532 | 117,443 | 51,372 |
Operating Cash Flow | 57,654 | 58,555 | 63,789 | 40,348 | 74,141 | 66,946 | 63,395 | 147,893 | 50,438 | 122,756 |
Capital Expenditure | -33,543 | -27,901 | -21,832 | -19,653 | -7,413 | -18,501 | -12,396 | -31,387 | -77,293 | -56,281 |
Free Cash Flow | 24,111 | 30,654 | 41,957 | 20,695 | 66,728 | 48,445 | 50,999 | 116,506 | -26,855 | 66,475 |
Currency | USD | USD | USD | USD | USD | USD | USD | USD | USD | USD |
(* All numbers are in thousands)
Revenue (TTM) : | P/S (TTM) : | 0.74 | ||
Net Income (TTM) : | P/E (TTM) : | 11.77 | ||
Enterprise Value (TTM) : | 1.199B | EV/FCF (TTM) : | 12.01 | |
Dividend Yield (TTM) : | 0.02 | Payout Ratio (TTM) : | 0.18 | |
ROE (TTM) : | 0.13 | ROIC (TTM) : | 0.11 | |
SG&A/Revenue (TTM) : | 0.02 | R&D/Revenue (TTM) : | 0 | |
Net Debt (TTM) : | 1.176B | Debt/Equity (TTM) | 0.09 | P/B (TTM) : | 1.47 | Current Ratio (TTM) : | 3.36 |
Trading Metrics:
Open: | 33.22 | Previous Close: | 33.67 | |
Day Low: | 32.46 | Day High: | 33.62 | |
Year Low: | 22.75 | Year High: | 46.92 | |
Price Avg 50: | 39.15 | Price Avg 200: | 36.86 | |
Volume: | 595526 | Average Volume: | 336929 |