Exchange: | NYSE |
Market Cap: | 9.291B |
Shares Outstanding: | 1.998B |
Sector: | Consumer Cyclical | |||||
Industry: | Auto – Manufacturers | |||||
CEO: | Mr. William Li | |||||
Full Time Employees: | 32820 | |||||
Address: |
|
|||||
Website: | https://www.nio.com |
Click to read more…
Operator: Hello, ladies and gentlemen. Thank you for standing by for NIO Incorporated’s First Quarter 2024 Earnings Conference Call. At this time, all participants are in listen-only mode. Today's conference call is being recorded. I will now turn the call over to your host, Mr. Rui Chen, Head of Investor Relations of the company. Please go ahead, Rui.
Rui Chen: Good morning, and good evening, everyone. Welcome to NIO's first quarter 2024 earnings conference call. The company's financial and operating results were published in the press release earlier today, and are posted at the company's IR website. On today's call, we have Mr. William Li, Founder, Chairman of the Board and Chief Executive Officer; Mr. Steven Feng, Chief Financial Officer; and Ms. Stanley Qu, Senior Vice President of Finance. Before we continue, please be kindly reminded that today's discussion will contain forward-looking statements made under the safe harbor provisions of the U.S. Private Securities Litigation Reform Act of 1995. Forward-looking statements involve inherent risks and uncertainties. As such, the company's actual results may be materially different from the views expressed today. Further information regarding risks and uncertainties is included in certain filings of the company with the U.S. Securities and Exchange Commission, the Stock Exchange of Hong Kong Limited and the Singapore Exchange Securities Trading Limited. The company does not assume any obligation to update any forward-looking statements, except as required under applicable law. Please also note that NIO's earnings press release and this conference call include discussions of unaudited non-GAAP -- GAAP financial information, as well as unaudited non-GAAP financial measures. Please refer to news press release, which contains a reconciliation of the unaudited non-GAAP measures to comparable GAAP measures. With that, I will now turn the call over to our CEO, Mr. William Li. William, please go ahead.
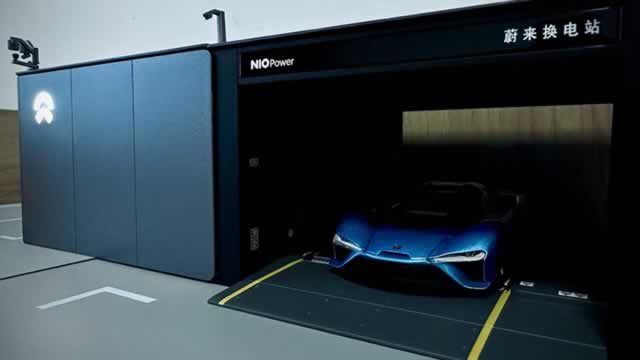
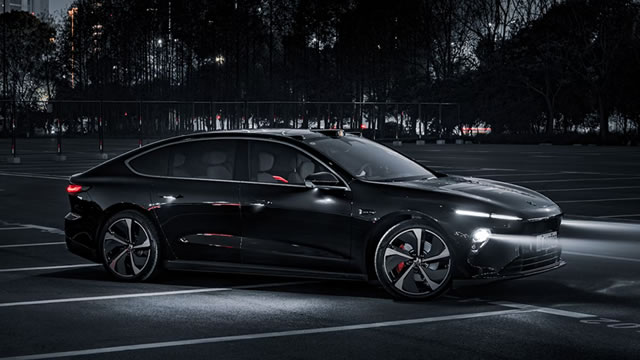
William Li: Hello, everyone. Thank you for joining NIO's 2024 Q1 earnings call. In Q1, NIO delivered 30,053 premium smart EV. In Q2, thanks to the launch of all model year products unleash of sales capabilities together with a more flexible sales policy. NIO's deliveries started to pick up month by month. In April, NIO delivered 15,620 vehicles and in May, 20,544 vehicles. Our market share in the premium BEV segment continued to grow, with year-over-year growth far above the segment average. The total deliveries in Q2 is expected to be between 54,000 and 56,000 units, up 129.6% to 138.1% year-over-year. In terms of NIO's financial performance, [indiscernible] year product transition in Q1. The vehicle margin was 9.2%. In the meantime, with the improvement on the utilization of the charging and the swapping facility and on the profitability of the after-sales services. Gross loss on the other sales was greatly reduced quarter-over-quarter. Now I would like to share with you the recent highlights of our products, R&D and operations. On April 25, the ET7 executive edition was launched at Beijing Auto Show. The delivery of this executive sedan has started in late April. With all around upgrades, the 2024 NIO ET7 batch caters to the needs of business community. It is well placed to compete with the premium electric (ph) model especially ICE models such as BMW 5 Series, Audi A6 and the Mercedes E-Class. In terms of NAD, on April 30, we started to push urban NOP Plus to all end users, making it the largest release of its current accessible by more than 265 end users and over 1.4 million kilometers of highway and urban street and in 726 cities in China. NOP Plus has been an industry leader in terms of its user base and the coverage. During the Labor Day holiday, 48.1% of the total mileage was driven with NOP Plus, making user journeys safer and more relaxing. Since day one, NIO has developed a clear brand road map starting from the premium segment to build up skills and experience, and then introducing a mass market brand to reach and serve more users. With that, we will be able to make greater contributions to a more sustainable future. On May 15, at the International Day of Family, we introduced ONVO, a new brand for the mainstream family market. ONVO is a form, ON Voyage and its Chinese name Le Dao, translates into Path to Happiness. Our mission to make family life better ONVO is committed to bringing products with the ultimate experience value and optimal ownership cost. The preorder of its first product, L60, was started. L60 is a smart electric mid-sized SUV. The official product launch and the delivery will begin in September. Launch of ONVO has shaped us into higher scale, expanding our reach to a wider user base. As more people are aware of our technologies and the products, we will add close vision of Blue Sky Company. As for the sales and service network, so far, NIO has 154 NIO houses and 388 NIO bases, as well as 344 service centers and 64 delivery centers. About the charging and the swapping network, so far, NIO has 2,472 power swap stations worldwide, and has provided over 45 million swaps. Besides, NIO has also installed over 22,000 power chargers and the destination chargers. In the meantime, more industry players have joined NIO's charging and swapping network. As of now, we have partnered with Changan, Geely, JAC, Chery, Lotus, GAC and FAW to jointly expand the standard battery swapping network. More investors have taken notice and recognize the value of NIO's charging and the swapping business. On May 31, NIO Power signed our strategic investment agreement of RMB1.5 billion with the support of strategic investors, NIO will be able to further develop its core technologies and expand the network. On May 13, NIO was named in the 2024 Fortune China ESG Impact List. We have continued to show the social responsibilities and lead by example in the ESG domain to further contribute to sustainable development worldwide. Despite the fierce competition, our continuous investment in technologies, products, services and the community starts to pay off and set us apart from others. NIO's premium brand positioning, industry-leading technologies and innovate chargeable, swappable and upgradable power experience have been recognized by more people and that driven steady sales rebound. We will continue to speed our software intuition, optimize products and experiences, improved system capabilities and operational efficiency to gain a larger market share. In the meantime, as the company unfolds is a multi-brand strategy and enter a broader market. We expect to bring out more potential for growth. As always, thank you for your support. With that, I will now turn the call over to Steven for Q1 financial details. Over to you, Steven.
Steven Feng: Thank you, William. I will now go over our key financial results for the first quarter of 2024. To keep this brief, I only refer to amounts in RMB today. I encourage listeners to refer to our earnings press release, which is posted online for additional details. Let's begin with revenue. For the quarter -- for the first quarter of 2024, total revenues were RMB9.9 billion, down 7.2% year-over-year and 42.1% quarter-over-quarter. 85% of revenue comes from vehicle sales in Q1, totaling RMB8.4 billion, down 9.1% year-over-year and 45.7% quarter-over-quarter. The decrease year-over-year was mainly attributed to lower average selling price, as a result of user rights adjustments since June 2023 and a decrease in delivery volume. The decrease quarter-over-quarter was mainly attributed to a 40% decrease in delivery volume, which was affected by seasonal factors. Turning to other sales. Other sales were RMB1.5 billion, showing a 5.2% increase year-over-year, an 8.2% decrease quarter-over-quarter. The year-over-year growth was mainly due to the increase in sales of parts after sales vehicle services and professional power solutions, which grew with our user base and partially offset by a decrease in revenue from sales of used cars and auto financing services. The decrease quarter-over-quarter was mainly attributed to a decrease in revenue from sales of used cars. Then let's have a look at the gross margin. Overall gross margin was 4.9%, compared with 1.5% in the same period of last year at 10.5% in the last quarter. Changes in gross margin were primarily driven by vehicle margins. Vehicle margin was 9.2% in this quarter, compared with 5.1% in Q1 2023 and 11.9% in Q4 2023. The year-over-year increase was mainly due to the decreased material cost per unit in Q1 2024. The quarter-over-quarter decrease was mainly due to lower average selling price, as a result of increased promotion during product transitioning, changes in product mix and partially offset by the decreased material costs per unit. Next, moving on to the operating expenses. R&D expenses were RMB2.9 billion declined 6.9% year-over-year and 27.9% quarter-over-quarter, which has been driven by decreased design and development costs and decreased ethanol costs in research and developments functions in the first quarter of 2024. SG&A expenses were RMB3 billion, increased by 22.5% year-over-year and decreased by 24.6% quarter-to-quarter. The year-over-year increase was mainly due to: first, the increase in personnel costs related to sales functions. Second, the increase in expenses related to the complete sales and service network expansion; and third, the increase in sales and marketing activities. The quarter-over-quarter decrease was mainly due to: first, the decrease in sales and marketing activities and professional services; and second, the decrease in personnel costs related to sales and general corporate functions. Now we proceed to the bottom line. Loss for operations was RMB5.4 billion, representing an increase of 5.5% year-over-year and a decrease of 18.6% quarter-over-quarter. Net loss was RMB5.2 billion, representing an increase of 9.4% year-over-year and a decrease of 3.4% quarter-over-quarter. And finally, our balance of cash and cash equivalents, restricted cash, short-term investments and long-term time deposits was RMB45.3 billion as of March 31, 2024. For more information and details of our first quarter 2024 financial results, please refer to our earnings press release. Now this concludes our prepared remarks. I will now turn the call over to the operator to proceed our Q&A session.
Operator: Thank you. [Operator Instructions] Your first question comes from Tim Hsiao from Morgan Stanley. Please go ahead.
Tim Hsiao: Hello and thanks for taking my questions and congratulations on a good feedback on ONVO and also some strategic breakthrough for NIO power. I have two questions. The first question is about the gross profit margin because as we remember, the company previously guided vehicle gross profit margin would be back to mid-teens as the strategic focus of NIO brand is profitability and cash generation, while ONVO would be the one going for volume. However, we saw increasing promotion for NIO brand in April and May, which worked pretty well actually and successfully boost the volume. Will management consider to continue this kind of more aggressive promotion on NIO brand for better volume in the upcoming months? And do we need to revise down our vehicle margin expectation? That's my first question.
William Li: Thank you, Tim. I will ask Stanley to answer the first question.
Stanley Qu: Yeah. I think regarding the gross margin, actually, we upgraded our NT2 product to 2024 version in -- from March. During the transition period of the model year product change, more promotions were offered to the automotives, leading to the decrease of our average selling price in Q1. And additionally, more lower margin models like ET5 and ET5T were sold in Q1. All those factors lead to the decrease of our gross margin. As you mentioned, we delivered over 20,000 vehicles to users in May with the recovery of sales volume. We will further optimize our product mix and negotiate with our supply chain partners for more cost efficiency in the following months. So we expect the vehicle margin will returned to double-digits in Q2 and continued to improve in Q3 and Q4. Yeah. But considering the intensifying market competition, we will also be more flexible on sales policy to make sure our market position is secure. Thank you, Tim.
Tim Hsiao: Thank you. That’s very clear. Thanks for sharing all the details. My second question is about NIO power. As William just mentioned, I think NIO Power secures the first external strategic investment of RMB1.5 billion or around $200 million. So looking forward, well, NIO Power get and accept more funding support from other car makers in the battery swap alliance? And separately, in addition to NIO Power, is there any other tick arms or business units within the group that could follow through to seek external capital injection and be gradually carved out? Could management team give us some examples? That's my second question. Thank you.
William Li: [Foreign Language] [Interpreted] Thank you for the question. For the NIO Power recently we have just completed the first round of fundraising. And after this round of financing, NIO still has around 90% of equity in NIO Power. And NIO Power is now open for the external investors, be it investment from the investors were from the car companies, we are open for that. Of course, for the longer-term, we do believe that NIO Power has a financial sustainability because we do have a promising and positive outlook for that. At the starting stage as we needed to build up the network for the power swap facilities, the upfront investment is relatively heavy. However, we do see a clear road map for the profitability with NIO Power. Let me share with you a number, right now for the breakeven point of a single power substation, it's around 60 swaps per day. And if you look at our current power swap service, every day on average, we offer around 100,000 power swaps with around 2,000 stations. It means that for each station on average, they are already providing around 30 swaps per day. So for the longer-term, we do see a viable road map for the sustainability and also the profitability of our power swap business. Not to mention that we can also leverage the revenues contributed by the energy storage and also the flexible battery upgrade of the power swap. Thank you, Tim.
Operator: Thank you. Your next question comes from Ming-Hsun Lee from Bank of America. Please go ahead.
Ming-Hsun Lee: William and the management team, this is Ming-Hsun from Bank of America. So my first question is regarding ONVO brand. So right now, we are close to the end of second quarter. So could you give us some guidance regarding on your sales channel expansion and also CapEx expense related to ONVO brand? And then also, could you give us a rough product pipeline for the ONVO brands? Thank you. That's my first question.
William Li: Thank you, Ming. [Foreign Language] [Interpreted] Thank you for your question. Our current plan is that when we started to launch and deliver the first product of ONVO in September this year, we are going to open up around 100 stores in China. CapEx less as ONVO sales stores or point of sales does not come with NIO house, which does not require heavy investment. In that case, the overall CapEx will be pretty efficient, around RMB1 million to RMB2 million per store. It won't be a very heavy burden from the CapEx perspective.
Ming-Hsun Lee: Could you give us rough – could you give us rough pipeline for ONVO brand. For example, like, [indiscernible] this year and then maybe [indiscernible] next year, is it?
William Li: [Foreign Language] [Interpreted] Regarding the ONVO’s product line, actually, the first product, L60, it will be directly competing with Model Y. It's a mid-sized SUV for family users. And next year, we are going to introduce the second product from ONVO. It will be a mid-large SUV for bigger families. We also have other products in the pipeline. But overall speaking ONVO, we will not have many products in its offering. We will be focusing on enhancing the market share and also the sales volume of each product in their respective segment. Overall speaking, the total sales volume for ONVO’s segment, which is a family car market with a starting price of around RMB200,000. The total size is around RMB4 million. And we do believe that we have a good opportunity and room for growth in that segment. Thank you, Ming.
Ming-Hsun Lee: Thank you, William. And my second question is related to your third brand, because we read that in news today that the [indiscernible] brand could be launched or show to the market probably by the end of this year? And could you also give us some latest update on the third brand? And last time during the earnings call, you mentioned that Firefly brand product could be sell in new households space. So could you confirm on this network strategy. Thank you.
William Li: [Foreign Language] [Interpreted] Thank you for the question. Regarding our third brand, Firefly, the R&D activities are in good progress. Several months ago, I've already tried one of the early builds of their first model, and it's pretty good. Regarding the Firefly product in the Chinese market, it will be target -- it will be able to compact vehicle. Although, its price segment is around RMB100,000 to RMB200,000, but it will follow a very high standard for the safety and the quality. So it will be a well-designed boutique car for the Chinese market. In terms of the sales channel, it will also share the point of sales with NIO, just like how [indiscernible] is sharing its dealership source with BMW. We will be using a similar approach. However, the selling price of Firefly will not be as expensive as many product-wise, it is definitely a very good project. We will start the product delivery from the first half of next year. Brand launch and the product launch, we don't have the specific date for that, but the delivery date is already more or less defined. That is the first half of next year.
Ming-Hsun Lee: Thank you, William.
William Li: Thank you.
Operator: Thank you. Your next question comes Ben Wang from Deutsche Bank. Please go ahead.
Ben Wang: Thank you. My question is about margin, because you will migrate to the NT3 this year. So all the NIO brand products migrate from NT2 (ph) to NT3, how much margin improve we can achieve through the technology upgrade. At the same time, based on 23.0 technology can provide a volume assumption to reach the overall company breakeven. That's my first question. Thank you.
William Li: [Foreign Language] [Interpreted] Thank you for the question. Regarding NIO brands, starting from next year, we will gradually upgrade our product to the third generation, and the first product on NT3 will be ET9. And for the third-generation product, we will also take different approaches to improve the vehicle margin. For example, we will start to put more in-house technologies into our vehicles, like chips for better vehicle margin performance. We also see some opportunities with the battery cost reductions. So overall speaking, our target for the NT3 product margin will be around 20% on average. And we do have a confidence of realizing that average margin of 20% from NT3. And regarding the breakeven target for the NIO brand, our target is still the same, that is to realize the monthly source volume of 30,000 units with a vehicle margin of around 20%, and then we will be breaking even with the core business of a NIO brand in China. And regarding our second brand ONVO, we have announced the presale price during the product launch -- during the brand launch, but we haven't released the final price yet. Even with the presale price, we can realize a pretty good vehicle margin. Of course, we also understand that the competition in ONVO’s segment is more intense than NIO in that case we will also strike a balance between the volume and the margin. We will not boost the sales volume at a cost of our vehicle margin. And for the longer term, our targets were ONVO’s product. Our margin target for ONVO’s products will also be above or even -- around or even above 15%. Because looking at Tesla, their current product margin is around 16% to 17%. And for ONVO realizing a margin of above 15% is also a reasonable and triple target for us in the longer term. For ONVO brand to breakeven its monthly sales volume should be at least 20,000 to 30,000 units per month.
Ben Wang: Thank you. My second question is about the order backlog for overall, you actually interviewed said that you are very traction about ONVO initial order backlog, some market talk is that you already have 60,000 cancelable order right now. Can you comment on that number and how success you are about ONVO orders so far? Thank you.
William Li: [Foreign Language] [Interpreted] As you know that for us, we never disclose any preorder intake or numbers as the preorders are refundable, and we don't see, it's a very solid reference for us to look at the actual performance of the product. However, it is true that with the preorder intake, it has surpassed our expectations as also mentioned by the President of ONVO [indiscernible] in some interviews. So overall speaking, without opening up any stores or having products to the market, we have already received the preorder set beyond our expectation, that's the information we can share.
Ben Wang: Thank you very much. Thank you.
William Li: Thank you, Ben Wang.
Operator: Thank you. Your next question comes from Paul Gong from UBS. Please go ahead.
Paul Gong: Thanks for taking my questions. Two question. The first question is, you mentioned that right now, you have 2,400 swap stations. To my personal understanding only the third generation and latest battery swap stations could help ONVO to swap the batteries. Could you please remind us how many units of the later generation battery swap stations could help for the unfold swap?
William Li: [Foreign Language] [Interpreted] Thank you for the question. For our third-generation power substation to be compatible with ONVO’s product, we do need to make some necessary modification. It is not a very expensive one, around RMB200,000 to RMB300,000 per station for the modification. So far, we have already installed more than 1,000 third generation power swap station, so that will be a base. In the meantime, we also see actually next week, we will start to install our fourth-generation power swap stations, and these stations will be compatible with both ONVO and new products. And also later this year, depending on the market and the demand, we will also see and decide how many fourth generation stations we need to deploy for NIO and ONVO products that all fourth generation stations can be accessed by ONVO products. Probably with that by end of the year, in the market, there will be more than 1,000 stations that can be compatible with ONVO products. Of course, it doesn't mean that we will modify all the fourth generation stations to ONVO users as not every station needs to be modified or opened up to the second brand. Not to mention that to start with ONVO will not have a very big user base for the current year. In that case, the experience of both brands will be pretty good. In the meantime, we also see some correlations between the number of power swap stations for the density of power swap stations in certain regions and the sales performance in that region. For example, in the Yangtze River Delta area, basically, half of our users are based out in that area. And in this area, we have already installed nearly 900 power swap stations. So there is a correlation between the number of stations and the number of stores. In that case, we are also developing an ROI model to calculate the return on the power swap station investment. In that case, our deployment of the power swap station and the decision on the deployment will be also relevant to their contributions to the sales volume be it sales of NIO or sales the ONVO brand. As right now, we have already initially established a charging and swapping network for China to cover most of the basic needs. For the next step, we will look closely the return on the investment of all the power swap stations, especially the return on the sales volume. In that case, our deployment next step will also be more targeted.
Paul Gong: Thank you. So my second question is regarding the NIO's license permit. I think you are among the first batch to receive the NIO Autonomous Driving and testing license permit. How do you plan to utilize this opportunity and how should you further develop on the autonomous driving technologies? Thank you.
William Li: [Foreign Language] [Interpreted] Thank you for the question. Yes, two days ago, we have received the L3 testing permit issued by ministries, including MIIT. And also among all the start-ups, we are one of the earliest to receive the first batch of permit issued by the government. This also represents a recognition of our technology. For the next step with the permit with the testing capability, we will be able to keep more frequent communications with the government regarding the application and also the testing of the higher levels of autonomous driving technologies, which will also be very important for the entire industry. Thank you, Paul.
Operator: Thank you. Your next question comes from Yuqian Ding from HSBC. Please go ahead.
Yuqian Ding: Thank you, team. My first question is probably still an extra mile on the margin pricing. So second quarter, probably we're going to see higher economic scale, almost doubled versus the first quarter, yet the promotion and also lower mix likely to remain as a dilution. So you talked about flexible on pricing earlier. So could you put us in a bit more context about how we prioritize pricing mix and volume and each of them are waiting on the margin side?
William Li: [Foreign Language] [Interpreted] Thank you for the question. In the April and also May, we have witnessed the increase in our sales volume, but such increase is actually due to multiple factors. The first is, we have just completed our model year face lifts in the first quarter of this year. With that, it has significantly improved the competitiveness of our product. And secondly, we have adjusted our vast policy. This March, we have announced our long-life battery strategy and also the adjustments to robust monthly subscription fee by optimizing our operations and also working with our battery suppliers for longer battery warranty, we can prolong the lifetime of the battery and lower the monthly fee for our users. This is actually a very important approach to boost the take rate of the BaaS service after the announcements and the adjustments the take rate of the Battery as a Service has raised to more than 80%. Also, we are offering some time limited promotions on the BaaS service. Right now, our users can buy four months of the best and enjoy one month for free. The third reason is regarding the improvement on our sales capabilities and capacity. In the second half of last year, we realized that we didn't have enough sales capacities and capabilities which means we didn't have enough point of sale where the sales persons on team. In that case, we started to build our sales capacity and capabilities. And starting March, April this year, we are seeing more and more qualified follows to contribute the sales and also orders to the company. So these are several major reasons that are boosting our sales volume in the past two months. In addition to that, there are several other reasons. For example, we are deploying and opening up one more power swap stations. More and more people are also getting to know and starting to recognize the value of chargeable, swappable and upgradable solution. And also, we have a pretty stable residual value on our used vehicles. Recently, there was an evaluation coming from the industry institution and the S8 and several other NIO models actually have the best RV performance among all the BEV products. So it is not just about the adjustments on the prices, not to mention that we haven't announced any price reductions on our product. We are offering some promotions like Battery as a Service policy promotions were some trading incentives for the ICE part users, but no price reductions on the product. In the meantime, we also will continue to improve our vehicle margin. So starting June we are taking several actions. The first is to keep improving our product mix. We have started to deliver our ET7 in late April. ET7, ES8 and the ET7 they are pretty competitive in their respective segments. And we will also encourage our frontline teams and our follows to put more focus on this high-margin product to help us optimize product mix. And secondly, we are also optimizing our variable marketing expenses. Starting in June, we are also dialing back on our time limited offers and promotions on the products. For example, we are reducing the number of free power swap broachers we gave out to our users. So overall speaking, we will keep improving our sales volume steadily, we are optimizing the vehicle margin.
Yuqian Ding: Thank you. That's very comprehensive. The next question is on the overseas business. The Europe union anti subsidy investigation towards China EV might come out as a preliminary result next week. So could we have an update refresher on NIO's overseas footprint, including Europe and also Middle East?
William Li: [Foreign Language] [Interpreted] Thank you for the question. It's true that the entire industry is waiting for the preliminary announcement on the anti-subsidy probe of Europe. From our perspective, we don't think such progress in the right direction. Imposing tariffs on the new energy vehicles is actually going against the initiative of the sustainable development of all human kinds. Of course, we will also adjust our directions and strategies according to the latest change on the tariffs of products. Overall speaking, at the moment, European -- the sales in our European market is still quite moderate in comparison to our total vehicle sales. So the impact on our short-term operations is limited. For the longer term, be it for NIO or for ONVO and Firefly product, we will also develop and make necessary adjustments to our strategies according to the latest tariff policy. Regarding the Middle East market entry later this year, we are going to start to offer our products and services in the UAE market. We are making market entry preparation right now.
Yuqian Ding: Thank you.
William Li: Thank you, Yuqian.
Operator: Thank you. Your next question comes from Cheng Jing from CICC. Please go ahead.
Cheng Jing: Hi. Thank you for taking my questions. My first question is a quick follow-up, question about -- so can we share – share with us more information on the financial impact of the major, especially fast policy adjustment for first quarter, such as our rental fee adjustment and also our [indiscernible] battery rental and also our light battery swap coupon, this financial impact, especially for our income statement. And this is my first question.
Stanley Qu: Yeah. About the price adjustment, I think two parts. First is about the price reduction from like 180 to 728, currently no material impact to NIO’s revenue and gross profit margin. I think as mentioned by William, we make this adjustment based on the assumptions that the battery can used for a longer time and also some optimization of the battery operations, so that's the first. And secondly, about the promotions used for months and one month for free. We granted this equity to the users for five years. So generally, the financial impact of this promotion is about below 6,000 per car, so that's the general impact of this policy.
Cheng Jing: Yeah. Thank you. My second question is about, also for our ONVO and also Firefly. So this year, we will ONVO’s first car in [indiscernible] Firefly to be launched. And our three sub-brands, including NIO will form a quite complete product matrix in next year. So can you share more information on this different positions and also the different relationships to these three brands? And also in what aspects can we collaborate.
William Li: [Foreign Language] [Interpreted] Thank you for the question. Regarding the positioning of our three different brands, actually, they are very clearly differentiated. For NIO, it is a premium brand target business-oriented users and business communities also have a deal over to the family-oriented users. For ONVO, it targets the premium family market -- mass market. So its target user is very clear family users. For Firefly, as I've mentioned, in China, it will be an affordable boutique compact car. We target the family-oriented users especially those families who are buying Firefly as their second vehicle, that's about the positioning of these three brands. Price-wise, it is also pretty clear. The starting prices of offer brands will be around RMB100,000, RMB200,000 and RMB300,000, that is also clearly differentiated. However, these three brands do share a similarity that is power swap all three brands can support power swap. In addition to power swap, three brands also shared the fundamental capabilities for smart technologies, electrification and also vehicle engineering capabilities. For example, when it comes to smart technologies, software-wise, hardware-wise, three brands can share quite a lot of synergies. For the power swap stations, as you’ve already -- as we’ve already mentioned, NIO and ONVO will be sharing the same power swap station and also structure. For the vehicle engineering, there are also quite a lot of capabilities that can be shared across all three brands. In terms of manufacturing and production, the first model of ONVO L60 will be manufactured in NIO’s second factory, NIO F2. So from this perspective, you can tell how much synergies we can leverage and how much investment we can share across three brands. Thank you, Cheng Jing.
Operator: Thank you. Your next question comes from Tina Hou from Goldman Sachs. Please go ahead.
Tina Hou: Thank you for taking my questions. So my first question is regarding actually just now William mentioned to keep the volumes steadily increase and then to improve gross margin. [Foreign Language] So can we interpret this as for the upcoming months? We do expect the vehicle volume to be above 20,000 units per month, that's my first question. Thanks.
William Li: [Foreign Language] [Interpreted] It's true that we do see a pretty stable demand on our products. Recently, we do have several small headaches. For example, in May, actually, the order demand has exceeded our production capacity. So the actual deliveries we achieved in May basically means the maximum vehicle -- maximum number of vehicles we can produce for that month. So we do see a steady and sustainable growth momentum on our order intake, and we have a confidence of continuing that.
Tina Hou: Thank you. Can I just have a quick follow-up for -- so for the -- I think starting from September, you will start to deliver ONVO. So does the 20,000 units sort of forecast or target include ONVO or exclude ONVO?
William Li: [Foreign Language] [Interpreted] After the launch of ONVO brand, we actually see positive impact on the sales of NIO project. It hasn't affected the demand on the NIO projects. In the meantime, we are also training the operators and also the frontline teams, so that we can get ready for the production of ONVO’s products. We may also arrange dual shifts in certain production lines or sections to fulfill the demand of both brands and the products. Regarding whether this number you've just mentioned, well, if it is -- if it has included the volume assumptions for ONVO, actually, it does not. That is only the assumption for the NIO brand.
Tina Hou: Thank you. That's very clear. Thanks, William. And then my second question is regarding the operating expenses. So first on SG&A. In the first quarter, we see SG&A actually increased by 22% year-over-year. So should we expect a similar type of increase in the following three quarters? And also actually starting from September since there will be 100 new stores for ONVO added, so in that – like, the last quarter, should we expect SG&A expense to grow even higher? And then in terms of R&D, on the other hand, I see it down 7% year-over-year. So for like overall R&D expense, what kind of annual spending level do you think it will be like a sustainable or a steady state kind of expense for us to keep competitive in terms of our hardware and software technology. Thank you.
Steven Feng : Yeah. Regarding the operating expense, the first is about selling expense. Yeah. Actually, in Q1, our marketing activities decreased considering the impact of Chinese New Year Festival and also the seasonal change. Starting from Q2, we are expecting that the percentage of selling expense against the vehicle revenues will be improved if our sales growth quarter-over-quarter can be achieved as planned. So that's about selling price. Along with the launch of ONVO, we don't think the efficiency will be like damaged since with the volume increase of ONVO we will have larger like sales revenue. So this is about the efficiency of selling expense. For the R&D expense, the fluctuation in Q1 is in line with the cadence of our R&D activities, especially the development of new vehicle models and core tech. Generally, the forecast for R&D expense in 2024 will be consistent with 2023. That is to say, the non-GAAP quarterly spending will be around RMB3 billion. I think this outlook is consistent with our prior quarter's like statement. Thank you, Tina.
Tina Hou: Thank you. Yes. I understand that in terms of SG&A as a percentage of revenue, it's going to decline. But just in terms of the year-over-year growth for SG&A. Shall we expect it to grow more than 22% this year.
Steven Feng : Yes. I think based on our current forecast, we don’t think it will exceed 20% in 2024.
Tina Hou: Okay. That’s very clear. Thank you.
Steven Feng : Thank you.
Operator: Thank you. As there are no further questions now, I'd like to turn the call back over to the company for closing remarks.
Rui Chen: Thank you for joining us today. If you have further questions, please feel free to contact NIO's IR team through the contact information provided on our website. This concludes the conference call. You may now disconnect your line. Thank you.
Subscribe now to gain full access to the earnings summary, 5 years analyst estimates and more exclusive content.
Subscribe NowWARNING: AI-generated summary.
While this is a phenomenal tool that can save you time and provide meaningful insights and key takeaways from the earnings call, it may contain inaccuracies or misinterpretations. For precise information, please refer to the original transcript.
(* All numbers are in thousands)
Fiscal Year | 2016 | 2017 | 2018 | 2019 | 2020 | 2021 | 2022 | 2023 |
---|---|---|---|---|---|---|---|---|
Revenue | 0 | 0 | 4,951,171 | 7,824,904 | 16,257,933 | 36,136,423 | 49,268,561 | 55,617,933 |
Cost Of Revenue | 0 | 0 | 5,207,047 | 9,023,726 | 14,384,514 | 29,314,990 | 44,124,568 | 52,566,137 |
Gross Profit | 0 | 0 | -255,876 | -1,198,822 | 1,873,419 | 6,821,433 | 5,143,993 | 3,051,796 |
Research And Development Expenses | 1,465,353 | 2,602,889 | 3,997,942 | 4,428,580 | 2,487,770 | 4,591,852 | 10,836,261 | 13,431,399 |
General And Administrative Expenses | 859,370 | 1,698,254 | 3,933,506 | 4,067,911 | 2,921,997 | 5,057,802 | 7,943,434 | 9,305,215 |
Selling And Marketing Expenses | 239,549 | 523,535 | 1,158,519 | 818,053 | 675,142 | 1,428,290 | 1,775,539 | 2,642,531 |
Selling General And Administrative Expenses | 1,098,919 | 2,221,789 | 5,341,790 | 5,451,787 | 3,932,271 | 6,878,132 | 10,537,119 | 11,947,746 |
Other Expenses | 3,429 | -58,681 | -21,346 | 66,160 | 61,023 | -152,248 | -588,728 | 155,191 |
Operating Expenses | 2,602,540 | 4,953,596 | 9,339,732 | 9,880,367 | 6,481,064 | 11,317,736 | 20,784,652 | 25,706,980 |
Cost And Expenses | 2,602,540 | 4,953,596 | 14,546,779 | 18,904,093 | 20,865,578 | 40,632,726 | 64,909,220 | 78,273,117 |
Interest Income | 27,556 | 18,970 | 133,384 | 160,279 | 166,904 | 911,833 | 1,358,719 | 2,210,018 |
Interest Expense | 55 | 18,084 | 123,643 | 370,536 | 426,015 | 637,410 | 333,216 | 403,530 |
Depreciation And Amortization | 46,087 | 167,858 | 474,223 | 1,520,973 | 1,545,721 | 2,351,914 | 3,994,055 | 4,907,441 |
EBITDA | -2,525,468 | -4,830,824 | -9,493,292 | -10,917,228 | -4,871,699 | -3,337,274 | -14,187,117 | -15,318,140 |
Operating Income | -2,602,540 | -4,953,596 | -9,595,608 | -11,079,189 | -4,607,645 | -4,496,303 | -15,640,659 | -22,655,184 |
Total Other Income Expenses Net | 6,099 | -60,558 | -31,068 | -208,575 | -690,069 | 521,619 | 1,258,658 | 389,778 |
income Before Tax | -2,568,940 | -5,013,268 | -9,616,935 | -11,287,764 | -5,297,714 | -3,974,684 | -14,382,001 | -20,458,918 |
Income Tax Expense | 4,314 | 7,906 | 22,044 | 7,888 | 6,368 | 42,265 | 55,103 | 260,835 |
Net Income | -2,536,316 | -4,984,734 | -9,660,571 | -11,295,652 | -5,304,082 | -4,016,949 | -14,437,104 | -21,146,967 |
Eps | -1.610 | -3.170 | -29.080 | -10.970 | -4.480 | -2.550 | -8.820 | -12.440 |
Eps Diluted | -1.610 | -3.170 | -29.080 | -10.970 | -4.480 | -2.550 | -8.820 | -12.440 |
Weighted Average Shares Outstanding | 1,572,702.112 | 1,572,702.112 | 332,153.211 | 1,029,931.705 | 1,182,660.948 | 1,572,702.112 | 1,636,999.280 | 1,700,203.973 |
Weighted Average Shares Outstanding Diluted | 1,572,702.112 | 1,572,702.112 | 332,153.211 | 1,029,931.705 | 1,182,660.948 | 1,572,702.112 | 1,636,999.280 | 1,700,203.886 |
Currency | CNY | CNY | CNY | CNY | CNY | CNY | CNY | CNY |
(* All numbers are in thousands)
Fiscal Year | 2016 | 2017 | 2018 | 2019 | 2020 | 2021 | 2022 | 2023 |
---|---|---|---|---|---|---|---|---|
Cash And Cash Equivalents | 581,296 | 7,505,954 | 3,133,847 | 862,839 | 38,425,541 | 15,333,719 | 19,887,575 | 32,935,111 |
Short Term Investments | 8,534 | 12,582 | 5,154,703 | 111,000 | 1,083,372 | 37,057,554 | 19,171,017 | 16,810,107 |
Cash And Short Term Investments | 581,296 | 7,505,954 | 8,288,550 | 973,839 | 39,508,913 | 52,391,273 | 39,058,592 | 49,745,218 |
Net Receivables | 182,871 | 505,998 | 844,574 | 1,402,876 | 4,120,035 | 4,349,139 | 6,499,126 | 8,999,233 |
Inventory | -41,597 | 89,464 | 1,465,239 | 889,528 | 1,081,553 | 2,056,352 | 8,191,386 | 5,277,726 |
Other Current Assets | 152,457 | 456,774 | -47,124 | 1,661,765 | -44,645 | -42,040 | 2,246,408 | 6,358,056 |
Total Current Assets | 875,027 | 8,310,005 | 12,169,632 | 4,928,008 | 46,206,817 | 63,641,315 | 59,149,752 | 70,380,233 |
Property Plant Equipment Net | 849,608 | 1,961,895 | 4,853,157 | 7,530,736 | 6,346,522 | 10,387,890 | 23,033,122 | 37,480,353 |
Goodwill | 0 | 0 | 0 | 0 | 0 | 0 | 0 | 0 |
Intangible Assets | 6,345 | 4,457 | 217,132 | 210,337 | 204,581 | 199,121 | 212,603 | 236,947 |
Goodwill And Intangible Assets | 6,345 | 4,457 | 217,132 | 210,337 | 204,581 | 199,121 | 212,603 | 236,947 |
Long Term Investments | 0 | 47,125 | 148,303 | 115,325 | 300,121 | 3,059,383 | 6,356,411 | 5,487,216 |
Tax Assets | 0 | 130,168 | 7,970 | 0 | 617 | 0 | 0 | 3,638,729 |
Other Non Current Assets | 39,498 | 14,384 | 1,446,358 | 1,797,623 | 1,583,271 | 5,595,892 | 7,512,037 | 159,724 |
Total Non Current Assets | 895,451 | 2,158,029 | 6,672,920 | 9,654,021 | 8,435,112 | 19,242,286 | 37,114,173 | 47,002,969 |
Other Assets | 0 | 0 | 0 | 0 | 0 | 0 | 0 | 0 |
Total Assets | 1,770,478 | 10,468,034 | 18,842,552 | 14,582,029 | 54,641,929 | 82,883,601 | 96,263,925 | 117,383,202 |
Account Payables | 0 | 234,011 | 2,869,953 | 3,111,699 | 6,368,253 | 12,638,991 | 25,223,687 | 14,111,853 |
Short Term Debt | 19,582 | 83,815 | 2,068,852 | 1,816,803 | 2,477,702 | 8,042,523 | 6,303,094 | 27,244,246 |
Tax Payables | 20,405 | 30,055 | 51,317 | 43,986 | 181,658 | 627,794 | 286,300 | 349,349 |
Deferred Revenue | 0 | 68,439 | 342,017 | 486,268 | 1,004,337 | 1,384,600 | 2,107,558 | 2,856,027 |
Other Current Liabilities | 706,983 | 1,232,249 | 3,312,564 | 4,084,088 | 4,125,948 | 7,132,038 | 12,217,715 | 13,585,990 |
Total Current Liabilities | 726,565 | 1,618,514 | 8,593,386 | 9,498,858 | 13,976,240 | 29,198,152 | 45,852,054 | 57,798,116 |
Long Term Debt | 37,500 | 642,401 | 1,168,012 | 8,753,170 | 6,953,540 | 12,056,369 | 17,402,895 | 23,135,091 |
Deferred Revenue Non Current | 19,644 | 30,416 | 545,420 | 636,582 | 1,004,197 | 1,764,150 | 2,597,873 | 3,375,002 |
Deferred Tax Liabilities Non Current | 4,902,651 | 19,846,893 | 783,777 | 819,205 | 3,687,090 | 25,199 | 218,189 | 212,347 |
Other Non Current Liabilities | 478 | -78,410 | 930,812 | 1,151,813 | 1,849,906 | 1,776,308 | 2,546,154 | 7,127,014 |
Total Non Current Liabilities | 4,960,273 | 20,441,300 | 3,428,021 | 11,360,770 | 13,494,733 | 15,622,026 | 22,765,111 | 33,849,454 |
Other Liabilities | 0 | 0 | 0 | 0 | 0 | 0 | 0 | 0 |
Capital Lease Obligations | 0 | 0 | 0 | 2,207,119 | 1,562,403 | 3,061,754 | 7,543,064 | 11,860,697 |
Total Liabilities | 5,686,838 | 22,059,814 | 12,021,407 | 20,859,628 | 27,470,973 | 44,820,178 | 68,617,165 | 91,647,570 |
Preferred Stock | 4,861,574 | 19,657,786 | 0 | 0 | 0 | 0 | 0 | 0 |
Common Stock | 52 | 60 | 1,809 | 1,827 | 2,679 | 2,892 | 2,922 | 3,622 |
Retained Earnings | -4,076,945 | -11,711,948 | -35,039,810 | -46,326,321 | -51,648,410 | -55,634,140 | -69,914,230 | -90,758,034 |
Accumulated Other Comprehensive Income Loss | 110,452 | -13,922 | -34,708 | -203,048 | -65,452 | -276,300 | 1,036,011 | 432,991 |
Other Total Stockholders Equity | -4,799,910 | -19,535,065 | 41,909,750 | 40,227,856 | 78,880,014 | 90,617,472 | 92,743,462 | 115,867,654 |
Total Stockholders Equity | -3,904,777 | -11,603,089 | 6,837,041 | -6,299,686 | 27,168,831 | 34,709,924 | 23,868,165 | 25,546,233 |
Total Equity | -3,916,360 | -11,591,780 | 6,821,145 | -6,277,599 | 27,170,956 | 38,063,423 | 27,646,760 | 25,735,632 |
Total Liabilities And Stockholders Equity | 1,770,478 | 10,468,034 | 18,842,552 | 14,582,029 | 54,641,929 | 82,883,601 | 96,263,925 | 117,383,202 |
Minority Interest | -11,583 | 11,309 | -15,896 | 22,087 | 2,125 | 3,353,499 | 3,778,595 | 189,399 |
Total Liabilities And Total Equity | 1,770,478 | 10,468,034 | 18,842,552 | 14,582,029 | 54,641,929 | 82,883,601 | 96,263,925 | 117,383,202 |
Total Investments | 8,534 | 47,125 | 5,303,006 | 226,325 | 1,383,493 | 40,116,937 | 25,527,428 | 22,297,323 |
Total Debt | 57,082 | 726,216 | 3,236,864 | 10,569,973 | 9,431,242 | 20,098,892 | 23,705,989 | 50,379,337 |
Net Debt | -524,214 | -6,779,738 | 103,017 | 9,707,134 | -28,994,299 | 4,765,173 | 3,818,414 | 17,444,226 |
Currency | CNY | CNY | CNY | CNY | CNY | CNY | CNY | CNY |
(* All numbers are in thousands)
Fiscal Year | 2016 | 2017 | 2018 | 2019 | 2020 | 2021 | 2022 | 2023 |
---|---|---|---|---|---|---|---|---|
Net Income | -2,573,254 | -5,021,174 | -9,638,979 | -11,295,652 | -5,304,082 | -4,016,949 | -14,437,104 | -20,719,753 |
Depreciation And Amortization | 46,087 | 167,858 | 474,223 | 1,520,973 | 1,545,721 | 2,351,914 | 3,994,055 | 4,907,441 |
Deferred Income Tax | 36,938 | 36,440 | 41,705 | 0 | 9,654 | 25,199 | 192,990 | 200,892 |
Stock Based Compensation | 76,684 | 90,296 | 679,468 | 333,495 | 187,094 | 1,010,140 | 2,295,896 | 2,369,041 |
Change In Working Capital | 256,862 | 130,729 | 505,654 | 436,837 | 4,829,873 | 2,692,744 | 4,443,964 | 13,085,438 |
Accounts Receivables | 0 | 0 | -756,508 | -681,556 | 237,928 | -1,717,747 | -2,303,364 | 453,382 |
Inventory | 0 | -89,464 | -1,375,862 | 569,163 | -197,828 | -990,550 | -6,257,514 | 2,895,477 |
Accounts Payables | 0 | 0 | 2,827,144 | 116,527 | 3,256,552 | 6,260,311 | 11,650,850 | 4,870,777 |
Other Working Capital | 256,862 | 220,193 | -189,120 | 432,703 | 1,533,221 | -859,270 | 1,353,992 | 4,865,802 |
Other Non Cash Items | -44,881 | 21,132 | 26,161 | 282,641 | 682,634 | -96,662 | -355,809 | -1,224,605 |
Net Cash Provided By Operating Activities | -2,201,564 | -4,574,719 | -7,911,768 | -8,721,706 | 1,950,894 | 1,966,386 | -3,866,008 | -1,381,546 |
Investments In Property Plant And Equipment | -654,455 | -1,113,893 | -2,643,964 | -1,706,787 | -1,127,686 | -4,078,764 | -6,972,854 | -14,340,771 |
Acquisitions Net | 0 | -79,878 | -110,900 | 45,153 | -250,826 | -592,570 | 7,717 | -421,729 |
Purchases Of Investments | -2,346,261 | -1,337,413 | -8,090,703 | -2,202,762 | -7,594,110 | -136,266,219 | -89,581,686 | -43,977,109 |
Sales Maturities Of Investments | 3,118,559 | 1,340,911 | 2,936,000 | 7,246,465 | 3,738,490 | 101,121,723 | 106,928,218 | 47,781,170 |
Other Investing Activites | 772,298 | -49,002 | -31,276 | 5,088,856 | 163,072 | 51,126 | 3,622 | 73,064 |
Net Cash Used For Investing Activites | 117,843 | -1,190,273 | -7,940,843 | 3,382,069 | -5,071,060 | -39,764,704 | 10,385,017 | -10,885,375 |
Debt Repayment | -37,500 | -325,013 | -120,205 | -2,654,874 | -1,293,141 | -2,465,128 | -8,577,795 | -9,521,177 |
Common Stock Issued | 0 | 0 | 7,531,037 | 50,790 | 34,607,139 | 12,677,554 | 0 | 20,962,289 |
Common Stock Repurchased | -8,408 | 0 | -7,490 | 0 | 0 | 0 | 0 | 0 |
Dividends Paid | 0 | 0 | 0 | 0 | 0 | 0 | 0 | 0 |
Other Financing Activites | 2,301,112 | 13,192,347 | 7,071,976 | 5,699,037 | 8,043,437 | 7,916,317 | 6,961,411 | -250 |
Net Cash Used Provided By Financing Activities | 2,292,704 | 12,867,334 | 11,603,092 | 3,094,953 | 41,357,435 | 18,128,743 | -1,616,384 | 27,662,881 |
Effect Of Forex Changes On Cash | 40,539 | -168,120 | -56,947 | 10,166 | -682,040 | -500,959 | -121,896 | 70,254 |
Net Change In Cash | 249,522 | 6,934,222 | -4,306,466 | -2,234,518 | 37,555,229 | -20,170,534 | 4,780,729 | 15,466,214 |
Cash At End Of Period | 596,631 | 7,530,853 | 3,224,387 | 989,869 | 38,545,098 | 18,374,564 | 23,155,293 | 38,621,507 |
Cash At Beginning Of Period | 347,109 | 596,631 | 7,530,853 | 3,224,387 | 989,869 | 38,545,098 | 18,374,564 | 23,155,293 |
Operating Cash Flow | -2,201,564 | -4,574,719 | -7,911,768 | -8,721,706 | 1,950,894 | 1,966,386 | -3,866,008 | -1,381,546 |
Capital Expenditure | -654,455 | -1,113,893 | -2,643,964 | -1,706,787 | -1,127,686 | -4,078,764 | -6,972,854 | -14,340,771 |
Free Cash Flow | -2,856,019 | -5,688,612 | -10,555,732 | -10,428,493 | 823,208 | -2,112,378 | -10,838,862 | -15,722,317 |
Currency | CNY | CNY | CNY | CNY | CNY | CNY | USD | CNY |
(* All numbers are in thousands)
Revenue (TTM) : | P/S (TTM) : | 1.06 | ||
Net Income (TTM) : | P/E (TTM) : | -3.35 | ||
Enterprise Value (TTM) : | 75.738B | EV/FCF (TTM) : | 0 | |
Dividend Yield (TTM) : | 0 | Payout Ratio (TTM) : | 0 | |
ROE (TTM) : | -1.06 | ROIC (TTM) : | -0.6 | |
SG&A/Revenue (TTM) : | 0.01 | R&D/Revenue (TTM) : | 0.21 | |
Net Debt (TTM) : | 7.85B | Debt/Equity (TTM) | 1.31 | P/B (TTM) : | 4.29 | Current Ratio (TTM) : | 1.11 |
Trading Metrics:
Open: | 4.41 | Previous Close: | 4.63 | |
Day Low: | 4.31 | Day High: | 4.84 | |
Year Low: | 3.61 | Year High: | 9.57 | |
Price Avg 50: | 5.55 | Price Avg 200: | 4.99 | |
Volume: | 89.61M | Average Volume: | 68.839M |