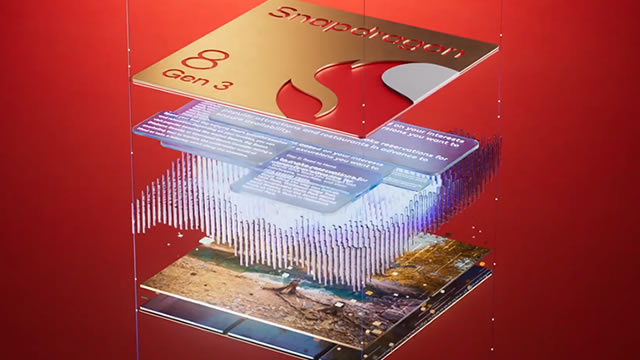
Exchange: | NASDAQ |
Market Cap: | 179.776B |
Shares Outstanding: | 1.111B |
Sector: | Technology | |||||
Industry: | Semiconductors | |||||
CEO: | Mr. Cristiano Renno Amon | |||||
Full Time Employees: | 50000 | |||||
Address: |
|
|||||
Website: | https://www.qualcomm.com |
Click to read more…
Operator: Ladies and gentlemen, thank you for standing by. Welcome to the Qualcomm Fourth Quarter and Fiscal 2024 Earnings Conference Call. [Operator Instructions] As a reminder, this conference is being recorded, November 6, 2024. The playback number for today's call is (877) 660-6853. International callers, please dial (201) 612-7415. The playback reservation number is 13749366. I would now like to turn the call over to Mauricio Lopez-Hodoyan, Vice President of Investor Relations. Mr. Lopez-Hodoyan, please go ahead.
Mauricio Lopez-Hodoyan: Thank you, and good afternoon, everyone. Today's call will include prepared remarks by Cristiano Amon and Akash Palkhiwala. In addition, Alex Rogers will join the question-and-answer session. You can access our earnings release and a slide presentation that accompany this call on our Investor Relations website. In addition, this call is being webcast on qualcomm.com, and a replay will be available on our website later today. During the call today, we will use non-GAAP financial measures as defined in Regulation G, and you can find the related reconciliations to GAAP on our website. We will also make forward-looking statements, including projections and estimates of future events, business or industry trends or business or financial results. Actual events or results could differ materially from those projected in our forward-looking statements. Please refer to our SEC filings, including our most recent 10-K, which contain important factors that could cause actual results to differ materially from the forward-looking statements. And now the comments from Qualcomm's President and Chief Executive Officer, Cristiano Amon.
Cristiano Amon: Thank you, Mauricio, and good afternoon, everyone. Thanks for joining us today. In fiscal Q4, we delivered non-GAAP revenues of $10.2 billion and non-GAAP earnings per share of $2.69. Chipset business revenues were $8.7 billion, and licensing business revenues were $1.5 billion. During Q4 in fiscal '24, we continue to make progress on our growth and diversification strategy, addressing new end markets for Qualcomm's technology. Our differentiated technology and product roadmaps lead in every industry in which we now participate, and we are very optimistic about the edge AI momentum across our business. As such, we will continue to transform Qualcomm from a wireless communications company into a connected computing company for the age of AI. In the current environment, more than ever, we remain extremely focused on executing our strategy and targets while maintaining operating discipline and creating value for our stockholders. I will now share some key highlights from across the business. As the strong pace of AI innovation continues, there is now broad recognition of the opportunity for on-device AI to enable new capabilities and transform the human computer interface. On-device AI provides context, enhances immediacy and reliability and enables personalization while providing privacy and security. Additionally, GenAI-enabled devices and applications are evolving to understand natural language, images, sound and the world around us, driving a new generation of AI-first experiences. This has the potential to create a new cycle of semiconductor innovation and content, and Qualcomm is well positioned to capitalize on this opportunity across devices at the edge. We shared this vision at the recent Snapdragon Summit with the support of key industry leaders, including Microsoft, Meta, Amazon, OpenAI, Mistral AI, IBM and others. Together with our ecosystem partners, we're driving this transition to AI-enabled edge computing to empower consumers and enterprises by enhancing productivity, entertainment, creativity, convenience and more. Notably, we're partnering with Meta to support Llama 3.2, including their multimodal 11 billion, 3 billion and 1 billion parameter models on Snapdragon-powered devices. We're also working with Amazon to create a cloud-to-edge solution that allows developers to customize their models on SageMaker and deploy them to Qualcomm and Snapdragon platforms via the AI Hub. Model availability on the AI Hub has grown by more than 50% since last quarter with both open source and proprietary models. In handsets, we recently unveiled the Snapdragon 8 Elite, our latest flagship mobile platform, which features our second-generation custom Oryon CPU. This CPU delivers up to 30% faster performance with 57% less power, a significant leap over the first generation in less than a year. Snapdragon 8 Elite is the world's fastest mobile processor, restoring performance leadership to the Android ecosystem. In addition, Snapdragon 8 Elite introduces a newly architected Hexagon NPU, delivering a 45% improvement in both performance and power efficiency over Snapdragon 8 Gen 3. Combined with the improved CPU and GPU, Snapdragon 8 Elite can dynamically manage AI workloads and handle the complexities of multimodal GenAI in real time. We are extremely pleased with the Snapdragon 8 Elite design traction with successful launches at Xiaomi, Honor, Oppo and Vivo, and we look forward to additional launches at Samsung, ASUS and more. In a short period of time, our Snapdragon X Series platforms have redefined personal computing. Building on the initial launch momentum, we have expanded our portfolio with the addition of the Snapdragon X Plus 8-core compute platform. The X Plus 8-core maintains leadership in performance and battery life, enabling OEMs to offer thin and light Copilot+ PCs with transformative, uncompromised on-device AI and more affordable price points. This makes next-gen AI PCs accessible to even more users, expanding our addressable market. We are very pleased that leading OEMs, including Dell, HP, Lenovo, Samsung, Acer and ASUS will all have devices powered by our X Plus 8-core platform. We now have a total of 58 platforms launched or in development across the X Series portfolio. Snapdragon X Series power laptops will also be the first to get the new Copilot+ PC features announced on October 1, including Recall, Click To Do, improved search, super resolution in photos, generative fill and erase in Paint. In XR, together with Meta, we continue to enable the future of spatial computing. The recently announced Quest 3S powered by Snapdragon XR2 Gen 2 delivers a more affordable headset, target for users new to mixed reality and immersive experiences. This is an important milestone in increasing the scale of this opportunity. Additionally, the Snapdragon AR1 Gen 1 powered Ray-Ban Meta glasses are receiving new AI features, including location and navigation assistance, real-time speech translation, answering questions about their environment and hands-free access to user digital lives. We're also pleased that Snap recently unveiled their next-generation Spectacles powered by dual Snapdragon processors, which are aimed at creators exploring advanced AR experiences. Industrial IoT is evolving with advanced edge computing and intelligence, driving demand for our technologies and providing a significant future opportunity for Qualcomm. To that end, we recently announced the Qualcomm IQ Series, a new family of industrial-grade solutions specifically designed to meet the needs of next-generation industrial edge applications. With on-device AI performance of up to 100 TOPS, the ability to operate in extreme conditions in a suite of building safety features, the Qualcomm IQ Series of chipsets are purpose-built to power a wide range of solutions, including inspection and automation, robotics, drones, advanced computer vision, edge AI boxes and gateways and more. Additionally, we introduced the Qualcomm IoT Solutions Framework, which helps enterprises build solutions that enable easy development of end-to-end applications, reduce time to implementation and improve operational efficiencies. This all-encompassing framework features recommended chipsets and core software support for multiple operating systems, such as Android, Linux and Windows, tailored reference designs, software libraries, SDKs, supplementary cloud-based services, microservices and access to a growing network of channel partners. In edge networking, we announced the Networking Pro A7 Elite platform, the first commercial platform to revolutionize enterprise and home networking connectivity with edge AI. This platform includes Wi-Fi 7, 5G, 10-gigabit PON, Ethernet and an AI co-processor with 40 TOPS of NPU processing power. The transformative integration of connectivity and computing power into the network unlocks opportunities for operators and enterprises to deploy innovative applications and services in areas such as security and surveillance, energy management and automation, personalized virtual assistance and health monitoring, among others. Edge AI also enhances privacy by processing sensitive information on the gateway while enabling personalization through contextualized understanding of the environment and immediacy to near real-time responses. Finally, in automotive, we recently announced our most powerful platforms to date, the Snapdragon Cockpit Elite and Snapdragon Ride Elite. Both feature our category-leading custom Oryon CPU, now optimized for automotive safety standards and design for 3x faster CPU performance over previous generations. These platforms are also developed for current and future multimodal AI in assisted driving workloads, feature our dedicated Hexagon NPU with up to 12x increased AI performance over previous generation, a substantial upgrade. The Snapdragon Cockpit Elite powers advanced digital experiences, including robust multimedia capabilities, such as gaming and advanced 3D graphics, on-device AI with fully integrated edge orchestrator, optimized safety and security and long-term software support. The Snapdragon Ride Elite platform offers an end-to-end ADAS system with advanced features, such as vision perception, sensor fusion, path planning, localization and complete vehicle control. Additionally, these platforms are built on a unique flexible architecture that gives automakers the option to combine both digital cockpit and automated driving functionalities on the same SoC. We are pleased that leading car manufacturers are adopting Snapdragon Elite automotive platforms for their future software-defined vehicles, including Li Auto and Mercedes-Benz. We are very pleased with the progress we have made this year with significant advancements on our product roadmap and customer engagement across multiple end markets. I look forward to sharing more about our strategy and progress at our upcoming growth and diversification focus Investor Day in New York on November 19. I will now turn the call to Akash.
Akash Palkhiwala: Thank you, Cristiano, and good afternoon, everyone. I'll start with our Fourth fiscal quarter earnings. We are pleased to announce strong non-GAAP results with revenues of $10.2 billion and EPS of $2.69, which was above the high end of our guidance. QTL revenues of $1.5 billion and EBT margin of 74% were at the high end of our guidance driven by slightly higher handset units in the quarter. QCT delivered revenues of $8.7 billion and EBT margin of 28% with revenues at the high end of our guidance range on strength in both IoT and automotive. QCT handset revenues of $6.1 billion were in line with our expectations for the quarter. QCT IoT revenues of $1.7 billion increased 24% from the prior quarter due to the benefit of new product launches and continued normalization of channel inventory. We delivered our fifth consecutive quarter of record QCT automotive revenues of $899 million with sequential growth of 11% and year-over-year growth of 68% on continued content increase in new vehicle launches. Lastly, we returned $2.2 billion to stockholders, including $1.3 billion in stock repurchases and $947 million in dividends. Before turning to guidance, I'll summarize our fiscal '24 results. We are very pleased with our execution and financial performance in fiscal '24. We delivered revenues of $39 billion and non-GAAP EPS of $10.22, a growth of 21% on a year-over-year basis. Our results reflect the benefit of operating leverage as we maintain fiscal discipline and manage non-GAAP operating expenses relatively flat as compared to fiscal '23. In QTL, we made significant progress in our ability to maintain revenue and margin scale as a result of completing a number of licensing renewals during the year. In QCT handsets, we delivered greater than 20% year-over-year growth in Android revenues driven by technology leadership of our premium-tier Snapdragon products and normalization of channel inventory. Consistent with expectations outlined at the beginning of the fiscal year, QCT IoT revenues grew sequentially in each of the following quarters throughout the year. In a challenging industry environment, we delivered full year revenue growth of 55% in QCT automotive, extending our leadership in automotive computing and connectivity platforms. Lastly, our business generated record free cash flow of $11.2 billion, and our balance sheet remains strong with $13.3 billion in cash and marketable securities. Turning to guidance. We now expect global 3G, 4G, 5G handset units to increase by low to mid-single-digit percentage on a year-over-year basis in calendar '24. For the first quarter of fiscal '25, we are forecasting revenues of $10.5 billion to $11.3 billion and non-GAAP EPS of $2.85 to $3.05. In QTL, we estimate revenues of $1.45 billion to $1.65 billion and EBT margins of 73% to 77%, reflecting normal seasonality for handset units when adjusted for the extra week in the fourth quarter of fiscal '24. In QCT, we expect revenues of $9 billion to $9.6 billion and EBT margins of 29% to 31%. We expect QCT handset revenues to grow by a mid-single-digit percentage on a year-over-year basis. This forecast includes greater than 40% sequential revenue growth from Chinese OEMs and the acceleration of flagship Android handset launches powered by our recently announced Snapdragon 8 Elite platform. We anticipate QCT IoT revenues to increase by more than 20% on a year-over-year basis with growth across consumer, industrial and networking. Following our outperformance in the fourth quarter, this forecast reflects a seasonal sequential decline consistent with the last 2 fiscal years. We expect QCT automotive revenues to grow by 50% relative to last year and be approximately flat on a sequential basis. Lastly, we estimate non-GAAP operating expenses to be approximately $2.2 billion. In closing, I want to thank our employees for their hard work and dedication and remaining focused on execution while delivering industry-leading products. The last few weeks have marked a meaningful acceleration in our progress towards our diversification strategy, and I'd like to highlight some significant product announcements. First, we announced our Snapdragon X Plus platform at IFA Conference, which extends our performance leadership to the $700 price-tier for personal computers. Second, at the Embedded World North America, we introduced the most comprehensive chipset and software portfolio for AI-ready industrial IoT solutions. And third, at the Snapdragon Summit, we unveiled the Snapdragon 8 Elite handset platform, featuring the world's fastest mobile CPU; and the Snapdragon Cockpit Elite and Snapdragon Ride Elite automotive platforms, establishing us as a performance leader in digital cockpit and ADAS. Lastly, we look forward to seeing you in New York on November 19, where we will expand on these exciting product announcements with an update on our IoT and automotive diversification strategy. This concludes our prepared remarks. Back to you, Mauricio.
Mauricio Lopez-Hodoyan: Thank you, Akash. Operator, we are now ready for questions.
Operator: [Operator Instructions] First question comes from Joe Moore with Morgan Stanley.
Joseph Moore: Great. Wondering if you could talk about the strength in autos, you've obviously put up great sequential numbers, there are headwinds in that business. I know you have a lot of pipeline momentum, but just kind of give us a picture of how the environment is affecting you and how much visibility you have into that trajectory?
Cristiano Amon: Joe, thanks for the question. This is Cristiano. As we said before, I think you should look at our revenue in auto, less sensitive to what happens in the market much more related to new models that are being launching with Qualcomm technology, and it's reflecting a shift in share. So as we gain share and new models get launched, you started to see that show up in our financials. So that's the reason we continue to have growth both sequentially and year-over-year.
Joseph Moore: Great. And then I don't think you mentioned it. Anything you could say about the ARM dispute? Because that would help us understand what's the stake there.
Akash Palkhiwala: Yes. Joe, on the ARM side, from our perspective, we have a very broad, well-established license rights that cover our custom design CPUs. So we are very confident that those rights will be affirmed. The trial is scheduled for December, and so we're looking forward to addressing ARM's claims at that point.
Operator: The next question is from the line of Samik Chatterjee with JPMorgan.
Samik Chatterjee: Really strong results, so congratulations on that. Maybe if I can start with IoT. You -- for the first 3 quarters of the year, you had declines on a year-over-year basis. And we're seeing this sort of acceleration in IoT in the fourth quarter and going into first quarter on a year-over-year basis. Can you just sort of parse that out a bit? How much of this is a recovery in sort of the traditional IoT businesses you are in relative to contribution from the PC market and really an acceleration on account of that? Just anything you can parse out between industrial IoT, consumer IoT and new products versus older sort of products you've been on. And I have a follow-up.
Akash Palkhiwala: Sure. So Samik, it's Akash. If you look at our performance both in first -- fourth quarter and first quarter in IoT, we saw benefit across all the 3 areas, so consumer, industrial and networking. And within fourth quarter, as some new products were launched in PC, in XR, in other areas as well, we saw the benefit of those launches come through in our numbers. There is a portion of channel inventory normalization as well, but it's really the new product launches kind of coming through for us both in the fourth and the first quarter. And that sets up -- sets us up well for the rest of the year.
Samik Chatterjee: Okay, okay. Got it. And I mean, it's -- obviously, as you mentioned, it's been a tough backdrop in terms of the macro, and you're guiding to about a 10% revenue growth in the first quarter, just trying to think about sustainability of that into the March quarter, particularly given that you did mention there's some acceleration of Android launches as well. How should we think about -- with the combination of smartphone and sort of the impressive performance you have on the non-smartphone areas now, how sustainable is this sort of double-digit growth into the March quarter?
Akash Palkhiwala: Yes. Samik, so we're pretty happy with the trajectory of the business both in terms of our fourth quarter results and first quarter guidance. We are not guiding beyond the first quarter at this point. But as you know, we have an Investor Day coming up in a couple of weeks, where we're going to talk through our diversification strategy and growth, and we'll provide a financial framework around it. So we'll address some of these topics at that point.
Operator: The next question is from the line of Stacy Rasgon with Bernstein Research.
Stacy Rasgon: My first question, just on chipset gross margins, they seem to be guided down a bit, I don't know, 100 or 150 bps in Q1. Is that just like increased wafer cost, [ TSM? ] Is there something else going on with mix just given which products are shipping? Any color you can give us on gross margins? And I guess, like is the framework on how to think about them going forward around 48-ish, plus or minus? Is that still the right way to think about chip gross margins?
Akash Palkhiwala: Yes. Sure, Stacy, it's Akash. So in fourth quarter, we actually guided lower, and we came in slightly better because of stronger mix. And so what we're guiding in first quarter is really largely in line with fourth quarter, and we think that's kind of a reasonable way to model the business going forward. And I think from a product mix perspective, we feel pretty good about where we are set up both across businesses and within handsets. So that will obviously continue to play a factor as we look forward.
Stacy Rasgon: Got it. For my follow-up, I just wanted to ask a little more about on PCs. You'd talked about new product launches in Q4. Can you help us size, like how big was the PC portion in Q4? And given you're guiding IoT down seasonally, sequentially in Q1, is PCs as well as some of the other stuff a function of that? Like how do we think about the contribution that we're seeing early in the launch of those products?
Akash Palkhiwala: Yes. So Stacy, as you know, we're pretty excited about the PC roadmap. I think we've kind of established ourselves as a performance leader in Windows devices. And during the quarter, we also launched a new chip, Snapdragon X Plus 8-core chip, which allows us now to access the $700 price tier for the PC market as well. So now we have performance leadership really without compromising on NPU performance across tiers in the PC market. And so initial reaction has been great. We are pleased with it. We will talk about this in a lot more detail at Investor Day, both from traction across OEMs and then targets for the longer term.
Cristiano Amon: Stacy, this is Cristiano. I just wanted to add one thing. While I think we are going to make probably financial projections, how we think about the PC business in November 19, I wanted to point out one thing which is very visible. When we launched this, we launched this in May, we are -- so in a short period of time if you think about it, we are now in November. When we launched in May, we have about 20 platforms. One thing we disclosed on this call is now the platforms that we have designed in, they add to about 58. That is almost a 3x increase on the number of platforms that are being designed and under development. I think that is giving us a lot of confidence that our platform to resonate with the market and we're getting traction with the OEMs.
Operator: Our next question is from Joshua Buchalter with TD Cowen.
Joshua Buchalter: I wanted to follow up on Joe's question from earlier about the auto upside. I mean, in particular, the auto space upside has been driven by China. I guess, maybe you could give us some data points on how much your exposure within the auto market is driven by the China market now? And then also maybe some -- any metrics you can give us on how much is infotainment versus ADAS? And in particular, as you ramp Snapdragon Ride Elite with capabilities of both infotainment and ADAS on one SoC, how is engagement for that? And how do you expect that to ramp over the next couple of years?
Akash Palkhiwala: Josh, it's Akash. From a geography diversity perspective, you should think of our portfolio as very diverse. We have a very strong set of design wins globally across OEMs. And so you should not think of this as reliant on a specific geography. And we are planning to give some disclosures on that topic as we go forward.
Cristiano Amon: Maybe just kind of add one thing. I think in addition of in design with virtually every single OEM and every region, one of the things we're very excited about it is what we did on both the Snapdragon Ride Elite and Cockpit Elite. One of the things I want to point out is it's one of the biggest upgrades, I think, to date in order of magnitude about 12x on AI. As we said before, I think GenAI use cases on a car and especially a little different approach is about future-proofing that design for software-defined vehicle is getting a lot of traction to a lot of OEMs. We announced two that made public, but I think design traction on that chipset is actually very high.
Akash Palkhiwala: And Josh, on your second question on a combination of cockpit and ADAS, a lot of our traction this year is with launches with cars using our cockpit solution. And we see ADAS having some traction, some deployments right now, but it's going to ramp over the next couple of years. And that becomes kind of another inflection point in our revenue growth going forward.
Joshua Buchalter: Got it. Thank you for all the color. And then a follow-up, I wanted to ask about the handset market. If we sort of back out your top 2 customers, handsets are up, I think, around 50% year-over-year. Any metrics you can give us on units versus ASPs? I know there was an inventory dynamic last year. So as we think about the sustainability of that growth vector into 2025, in particular, for the China market, would be curious if there's any incremental metrics you can give us outside your top 2 customers.
Akash Palkhiwala: Yes. I think, Josh, the -- if you look at the total handset market, and this is sell-through, we are projecting in '24 that the market will be up low to mid-single digits. But the big story for us has been content increase. We've kind of seen the chipsets becoming a lot more capable, and you saw the X Elite -- 8 Elite announcement that we did last month, a lot more content is going into the chip. And as those get -- solutions get adopted, we get to see the benefit on the ASP side. The second factor is the mix across tiers. We're seeing the mix across tiers continue to improve in the handset market as well. So if you kind of look back over the last 3 or 4 years, devices greater than $400 has gone up from being 21% of the market to 30% of the market, and that is definitely beneficial to us. Maybe one last point is, if you think about our guidance quarter, December quarter, we do not have any Huawei product revenue in our guidance. A year ago quarter, we did have Huawei product revenue. So it's actually something that we overcome, and then we have growth on top of it.
Operator: Our next question is from Chris Caso with Wolfe Research.
Christopher Caso: Just another follow-up question with regard to handset. And if you could kind of characterize because I think for Qualcomm, you saw a rebound or normalization in the premium part of the handset market in the first half of the year. Is what you're seeing now some follow-through on kind of the mid-tier or it's just kind of continuation of what you saw in the first half of the year? And then secondly on that, with regard to some of the accelerated China launches, do you think that's a reflection of the market, of some perhaps improvement in the market in China or at least the China OEMs? Or is it simply a matter of timing?
Akash Palkhiwala: Yes. I think, Chris, if you think about our handset business, we're definitely really strong at the top of the roadmap in premium tier. And as we mentioned earlier, we announced our new flagship chipset, and you're seeing OEMs launch with that chipset. So those definitely factor into our numbers. And it's less about other tiers, more about the fact that we launched our new premium-tier chipset, and the OEMs are actively taking advantage of it by accelerating their launches and really increasing the scale of their launches.
Christopher Caso: Got it. And just with regard to the licensing business, you see a shallow sequential increase in the December quarter. I imagine that's because of the absence of the extra week for that licensing business. Any changes for just kind of the structure of that market that we shouldn't anticipate going forward? Or is it about what you'd consider to be normal?
Akash Palkhiwala: Yes, it's very much normal. It's really the extra week coming out and the normal sequential quarter-over-quarter growth.
Operator: The next question is from Tal Liani with Bank of America.
Tal Liani: Other companies reported kind of opposite trends of what you're talking about. Some of the companies reported weakness in China migration to lower tier, and then Apple had kind of weaker numbers than expected. How do you connect the comments we get from other vendors to your strengths? And are you concerned that maybe the strength is more inventory build-out or build-out by customers because of your new launches? So can you comment about end-market demand and the composition of end-market demands in -- globally?
Cristiano Amon: Look, thanks for the question. I can't really speak of other companies. The only thing I can say is I'm actually very happy with our results. But I'll give you a couple of data points, maybe help you triangulate that. When we look sequentially, we have now quarter-over-quarter greater than 40% handset revenue growth with Chinese OEMs in -- as we look in the 1Q fiscal '25, if you look at the guide. In fiscal '24, our Android revenues, we get 20% year-over-year growth, including the loss of Huawei revenues. And when we compare with our closest competitor, for example, in Android, our premium tier, we get greater than 5x the premium-tier revenue. So I think it shows a couple of things. As Akash outlined, content is increasing. The premium tier is expanding in the market that it kind of normalized. And we don't see much of the inventory dynamics we used to see. So I think it speaks a little bit to the strength of our product roadmap. I think the launch of new products from customers in China, but more important is this trend that the mix are really improving.
Operator: The next question is from Timothy Arcuri with UBS.
Timothy Arcuri: Akash, I'm just looking at the guidance, and for China Android to be up more than 40%, it implies that your 2 other big customers are both down in the double-digit range. I mean both of them have to be down. So can you speak to that? It's very sort of anti-seasonal for at least one of those guys to be down. And then can you speak to what's driving this? Do you think -- I mean, is any of this pull-forward because of tariffs? Are these customers concerned about potential tariffs with -- given the results of the election? So maybe they are pulling some things forward. Is that plausible?
Akash Palkhiwala: Yes. Let me start with the second part of your question. That's not the case. This is not about tariffs or pull-forward because of those reasons. From a customer perspective on the quarterly trend, the way we think about it is what we're guiding is based on customer launch cadences and their demands. You should not think of this as a statement on sell-through. It's really kind of chipset purchases that are happening from us. So I think that's -- those 2 may be disconnected in some cases. But you already know what our share position is across OEMs. And so it's not a share question. It's just the timing of purchases from us.
Operator: Our final question will be from C.J. Muse with Cantor Fitzgerald.
Christopher Muse: I guess first question, was hoping to revisit IoT business growing nicely for you year-on-year, and pretty much every other company that I've come across is seeing challenges there, particularly parts of consumer and industrial. So would love to hear perhaps on the consumer side, whether you're seeing kind of the uptake that we're hearing in China. And then moreover, I guess, on the industrial side, is that where you're seeing inventory correction? What's the timing of kind of recovery and your thoughts there?
Akash Palkhiwala: Yes. Sure. So on the consumer side, as we said, new product launches, both in XR and NPC, definitely a factor in our performance. And then on the industrial side, at Embedded World, we announced a new product portfolio, updated product portfolio that addresses both not just chipsets but software readiness to drive through AI-ready use cases in industrial. We think that, that market is turning. There's an inflection point and there's going to be a lot of demand for solutions that have processing, connectivity, AI readiness. And so we're seeing this early stages of demand come through for our solutions. And this is one of the topics that we'll discuss in detail at our Investor Day. So stay tuned on that one.
Christopher Muse: Very helpful. And as a follow-up, in your 10-K, you talked about a large customer potentially going internal as a next several quarter risk. And obviously, this has been discussed for many years. But if it were to happen, how should we think about the moving parts to your overall QCT margins?
Akash Palkhiwala: I think no real change, no new information here. I think you -- there's enough data out there for you to be able to size the risk that we've always outlined. As we've said, we have a 3-year agreement, '24, '25 and '26 phone launches, and the framework of that agreement is consistent with the prior one. Our planning assumption has been that the share will ramp down to 20% for the '26 launch, and the agreement ends after that. So no change really to anything we've said in the past, and I think that's how our planning assumption is. Anything better would be upside.
Operator: That concludes our question-and-answer session. Mr. Amon, do you have anything further to add before adjourning the call?
Cristiano Amon: Yes, just a few statements. Thank you. Thanks, everyone, for joining us on the call today. When we look at Qualcomm, I think we feel pretty good at our position. There are very few companies positioned in so many markets, and the transformations of many industries. We -- there's a lot of distraction out there, but we're not distracted. We're really focused on executing on our growth and diversification. And we're really looking forward, I think, to tell our story on November 19. I'd like to take a moment to thank all of our employees for incredible fiscal year -- Fiscal '24. They're truly the best part of Qualcomm. And we're going to be keep executing and focus on changing the company into a connected computing company for the age of AI. Thank you so much, and I look forward to speaking with you all next quarter.
Operator: Ladies and gentlemen, this concludes today's conference call. You may now disconnect.
Subscribe now to gain full access to the earnings summary, 5 years analyst estimates and more exclusive content.
Subscribe NowWARNING: AI-generated summary.
While this is a phenomenal tool that can save you time and provide meaningful insights and key takeaways from the earnings call, it may contain inaccuracies or misinterpretations. For precise information, please refer to the original transcript.
(* All numbers are in thousands)
Fiscal Year | 2015 | 2016 | 2017 | 2018 | 2019 | 2020 | 2021 | 2022 | 2023 | 2024 |
---|---|---|---|---|---|---|---|---|---|---|
Revenue | 25,281,000 | 23,554,000 | 22,291,000 | 22,732,000 | 24,273,000 | 23,531,000 | 33,566,000 | 44,200,000 | 35,820,000 | 38,962,000 |
Cost Of Revenue | 10,378,000 | 9,749,000 | 9,792,000 | 10,244,000 | 8,599,000 | 9,255,000 | 14,262,000 | 18,635,000 | 15,869,000 | 17,060,000 |
Gross Profit | 14,903,000 | 13,805,000 | 12,499,000 | 12,488,000 | 15,674,000 | 14,276,000 | 19,304,000 | 25,565,000 | 19,951,000 | 21,902,000 |
Research And Development Expenses | 5,490,000 | 5,151,000 | 5,485,000 | 5,625,000 | 5,398,000 | 5,975,000 | 7,176,000 | 8,194,000 | 8,818,000 | 8,893,000 |
General And Administrative Expenses | 0 | 0 | 0 | 0 | 0 | 0 | 0 | 0 | 0 | 0 |
Selling And Marketing Expenses | 0 | 0 | 0 | 0 | 0 | 0 | 0 | 0 | 0 | 0 |
Selling General And Administrative Expenses | 2,344,000 | 2,385,000 | 2,658,000 | 2,986,000 | 2,195,000 | 2,074,000 | 2,339,000 | 2,570,000 | 2,483,000 | 2,759,000 |
Other Expenses | 1,293,000 | -226,000 | 1,742,000 | 3,135,000 | 414,000 | -28,000 | 130,000 | -1,059,000 | 86,000 | 179,000 |
Operating Expenses | 9,127,000 | 7,310,000 | 9,885,000 | 11,746,000 | 8,007,000 | 8,021,000 | 9,515,000 | 9,705,000 | 12,163,000 | 11,831,000 |
Cost And Expenses | 19,505,000 | 17,059,000 | 19,677,000 | 21,990,000 | 16,606,000 | 17,276,000 | 23,777,000 | 28,340,000 | 28,032,000 | 28,891,000 |
Interest Income | 527,000 | 611,000 | 619,000 | 625,000 | 316,000 | 156,000 | 83,000 | 91,000 | 313,000 | 0 |
Interest Expense | 104,000 | 297,000 | 494,000 | 768,000 | 627,000 | 602,000 | 559,000 | 490,000 | 694,000 | -697,000 |
Depreciation And Amortization | 1,214,000 | 1,428,000 | 1,461,000 | 1,561,000 | 1,401,000 | 1,393,000 | 1,582,000 | 1,762,000 | 1,809,000 | 0 |
EBITDA | 6,990,000 | 7,923,000 | 4,075,000 | 2,303,000 | 9,068,000 | 7,648,000 | 11,371,000 | 17,565,000 | 9,597,000 | 10,071,000 |
Operating Income | 5,776,000 | 6,495,000 | 2,614,000 | 742,000 | 7,667,000 | 6,255,000 | 9,789,000 | 15,860,000 | 7,788,000 | 10,071,000 |
Total Other Income Expenses Net | 815,000 | 635,000 | 900,000 | 539,000 | -186,000 | -536,000 | 485,000 | -862,000 | 349,000 | 265,000 |
income Before Tax | 6,487,000 | 6,833,000 | 3,020,000 | 513,000 | 7,481,000 | 5,719,000 | 10,274,000 | 14,998,000 | 7,443,000 | 10,336,000 |
Income Tax Expense | 1,219,000 | 1,131,000 | 555,000 | 5,377,000 | 3,095,000 | 521,000 | 1,231,000 | 2,012,000 | 104,000 | -226,000 |
Net Income | 5,271,000 | 5,705,000 | 2,466,000 | -4,864,000 | 4,386,000 | 5,198,000 | 9,043,000 | 12,936,000 | 7,232,000 | 10,142,000 |
Eps | 3.260 | 3.840 | 1.660 | -3.320 | 3.620 | 4.580 | 8 | 11.520 | 6.470 | 9.090 |
Eps Diluted | 3.220 | 3.810 | 1.640 | -3.320 | 3.600 | 4.520 | 7.870 | 11.380 | 6.420 | 8.980 |
Weighted Average Shares Outstanding | 1,618,000 | 1,484,000 | 1,477,000 | 1,463,000 | 1,210,000 | 1,135,000 | 1,131,000 | 1,123,000 | 1,117,000 | 1,116,000 |
Weighted Average Shares Outstanding Diluted | 1,639,000 | 1,498,000 | 1,490,000 | 1,463,000 | 1,220,000 | 1,149,000 | 1,149,000 | 1,137,000 | 1,126,000 | 1,130,000 |
Currency | USD | USD | USD | USD | USD | USD | USD | USD | USD | USD |
(* All numbers are in thousands)
Fiscal Year | 2015 | 2016 | 2017 | 2018 | 2019 | 2020 | 2021 | 2022 | 2023 | 2024 |
---|---|---|---|---|---|---|---|---|---|---|
Cash And Cash Equivalents | 7,560,000 | 5,946,000 | 35,029,000 | 11,777,000 | 11,839,000 | 6,707,000 | 7,116,000 | 2,773,000 | 8,450,000 | 7,849,000 |
Short Term Investments | 9,761,000 | 12,702,000 | 2,279,000 | 311,000 | 421,000 | 4,507,000 | 5,298,000 | 3,609,000 | 2,874,000 | 5,451,000 |
Cash And Short Term Investments | 17,321,000 | 18,648,000 | 37,308,000 | 12,088,000 | 12,260,000 | 11,214,000 | 12,414,000 | 6,382,000 | 11,324,000 | 13,300,000 |
Net Receivables | 1,964,000 | 2,219,000 | 3,632,000 | 2,904,000 | 2,471,000 | 4,003,000 | 3,579,000 | 5,643,000 | 3,183,000 | 3,929,000 |
Inventory | 1,492,000 | 1,556,000 | 2,035,000 | 1,693,000 | 1,400,000 | 2,598,000 | 3,228,000 | 6,341,000 | 6,422,000 | 6,423,000 |
Other Current Assets | 687,000 | 558,000 | 618,000 | 699,000 | 634,000 | 704,000 | 854,000 | 1,625,000 | 1,194,000 | 1,579,000 |
Total Current Assets | 22,099,000 | 22,981,000 | 43,593,000 | 17,384,000 | 16,765,000 | 18,519,000 | 20,075,000 | 20,724,000 | 22,464,000 | 25,231,000 |
Property Plant Equipment Net | 2,534,000 | 2,306,000 | 3,216,000 | 2,975,000 | 3,081,000 | 3,711,000 | 4,559,000 | 5,168,000 | 5,042,000 | 4,665,000 |
Goodwill | 5,479,000 | 5,679,000 | 6,623,000 | 6,498,000 | 6,282,000 | 6,323,000 | 7,246,000 | 10,508,000 | 10,642,000 | 10,799,000 |
Intangible Assets | 3,742,000 | 3,500,000 | 3,737,000 | 2,955,000 | 2,172,000 | 1,653,000 | 1,458,000 | 1,882,000 | 1,408,000 | 1,244,000 |
Goodwill And Intangible Assets | 9,221,000 | 9,179,000 | 10,360,000 | 9,453,000 | 8,454,000 | 7,976,000 | 8,704,000 | 12,390,000 | 12,050,000 | 12,043,000 |
Long Term Investments | 13,626,000 | 13,702,000 | 1,270,000 | 35,000 | 1,130,000 | 982,000 | 1,372,000 | 1,294,000 | 1,375,000 | 0 |
Tax Assets | 1,453,000 | 2,030,000 | 2,900,000 | 904,000 | 1,196,000 | 1,351,000 | 1,591,000 | 1,803,000 | 3,310,000 | 5,162,000 |
Other Non Current Assets | 1,863,000 | 2,161,000 | 4,147,000 | 1,935,000 | 2,331,000 | 3,055,000 | 4,939,000 | 7,635,000 | 6,799,000 | 8,053,000 |
Total Non Current Assets | 28,697,000 | 29,378,000 | 21,893,000 | 15,302,000 | 16,192,000 | 17,075,000 | 21,165,000 | 28,290,000 | 28,576,000 | 29,923,000 |
Other Assets | 0 | 0 | 0 | 0 | 0 | 0 | 0 | 0 | 0 | 0 |
Total Assets | 50,796,000 | 52,359,000 | 65,486,000 | 32,686,000 | 32,957,000 | 35,594,000 | 41,240,000 | 49,014,000 | 51,040,000 | 55,154,000 |
Account Payables | 1,300,000 | 1,858,000 | 1,971,000 | 1,825,000 | 1,368,000 | 2,248,000 | 2,750,000 | 3,796,000 | 1,912,000 | 2,584,000 |
Short Term Debt | 1,000,000 | 1,749,000 | 2,495,000 | 1,005,000 | 2,496,000 | 500,000 | 2,044,000 | 1,945,000 | 914,000 | 1,364,000 |
Tax Payables | 0 | 0 | 0 | 453,000 | 480,000 | 549,000 | 862,000 | 634,000 | 1,717,000 | 0 |
Deferred Revenue | 583,000 | 509,000 | 502,000 | 500,000 | 565,000 | 568,000 | 612,000 | 369,000 | 293,000 | 297,000 |
Other Current Liabilities | 3,217,000 | 3,195,000 | 5,939,000 | 7,906,000 | 4,506,000 | 5,356,000 | 6,545,000 | 5,756,000 | 6,509,000 | 6,259,000 |
Total Current Liabilities | 6,100,000 | 7,311,000 | 10,907,000 | 11,236,000 | 8,935,000 | 8,672,000 | 11,951,000 | 11,866,000 | 9,628,000 | 10,504,000 |
Long Term Debt | 9,969,000 | 10,008,000 | 19,398,000 | 15,365,000 | 13,437,000 | 15,226,000 | 13,701,000 | 13,537,000 | 14,484,000 | 13,270,000 |
Deferred Revenue Non Current | 2,496,000 | 2,377,000 | 2,003,000 | 1,620,000 | 1,160,000 | 761,000 | 364,000 | 144,000 | 99,000 | 0 |
Deferred Tax Liabilities Non Current | 0 | 169,000 | 233,000 | 2,312,000 | 2,088,000 | 1,872,000 | 1,713,000 | 2,267,000 | 1,118,000 | 0 |
Other Non Current Liabilities | 817,000 | 726,000 | 2,199,000 | 1,225,000 | 2,428,000 | 2,986,000 | 3,561,000 | 3,187,000 | 4,130,000 | 5,106,000 |
Total Non Current Liabilities | 13,282,000 | 13,280,000 | 23,833,000 | 20,522,000 | 19,113,000 | 20,845,000 | 19,339,000 | 19,135,000 | 19,831,000 | 18,376,000 |
Other Liabilities | 0 | 0 | 0 | 0 | 0 | 0 | 0 | 0 | 0 | 0 |
Capital Lease Obligations | 0 | 0 | 0 | 0 | 0 | 487,000 | 428,000 | 573,000 | 571,000 | 0 |
Total Liabilities | 19,382,000 | 20,591,000 | 34,740,000 | 31,758,000 | 28,048,000 | 29,517,000 | 31,290,000 | 31,001,000 | 29,459,000 | 28,880,000 |
Preferred Stock | 0 | 0 | 0 | 0 | 0 | 0 | 0 | 0 | 0 | 0 |
Common Stock | 0 | 414,000 | 274,000 | 0 | 343,000 | 586,000 | 0 | 195,000 | 490,000 | 0 |
Retained Earnings | 31,226,000 | 30,936,000 | 30,088,000 | 663,000 | 4,466,000 | 5,284,000 | 9,822,000 | 17,840,000 | 20,733,000 | 25,687,000 |
Accumulated Other Comprehensive Income Loss | 195,000 | 428,000 | 384,000 | 265,000 | 100,000 | 207,000 | 128,000 | -22,000 | 358,000 | 587,000 |
Other Total Stockholders Equity | 0 | 0 | 0 | 0 | 0 | 0 | 0 | 0 | 0 | 0 |
Total Stockholders Equity | 31,421,000 | 31,778,000 | 30,746,000 | 928,000 | 4,909,000 | 6,077,000 | 9,950,000 | 18,013,000 | 21,581,000 | 26,274,000 |
Total Equity | 31,414,000 | 31,768,000 | 30,746,000 | 928,000 | 4,909,000 | 6,077,000 | 9,950,000 | 18,013,000 | 21,581,000 | 26,274,000 |
Total Liabilities And Stockholders Equity | 50,796,000 | 52,359,000 | 65,486,000 | 32,686,000 | 32,957,000 | 35,594,000 | 41,240,000 | 49,014,000 | 51,040,000 | 55,154,000 |
Minority Interest | -7,000 | -10,000 | 0 | 0 | 0 | 0 | 0 | 0 | 0 | 0 |
Total Liabilities And Total Equity | 50,796,000 | 52,359,000 | 65,486,000 | 32,686,000 | 32,957,000 | 35,594,000 | 41,240,000 | 49,014,000 | 51,040,000 | 55,154,000 |
Total Investments | 23,387,000 | 26,404,000 | 3,549,000 | 346,000 | 421,000 | 4,507,000 | 5,298,000 | 3,609,000 | 2,874,000 | 5,451,000 |
Total Debt | 10,969,000 | 11,757,000 | 21,893,000 | 16,370,000 | 15,933,000 | 15,726,000 | 15,745,000 | 15,482,000 | 15,398,000 | 14,634,000 |
Net Debt | 3,409,000 | 5,811,000 | -13,136,000 | 4,593,000 | 4,094,000 | 9,019,000 | 8,629,000 | 12,709,000 | 6,948,000 | 6,785,000 |
Currency | USD | USD | USD | USD | USD | USD | USD | USD | USD | USD |
(* All numbers are in thousands)
Fiscal Year | 2015 | 2016 | 2017 | 2018 | 2019 | 2020 | 2021 | 2022 | 2023 | 2024 |
---|---|---|---|---|---|---|---|---|---|---|
Net Income | 5,268,000 | 5,702,000 | 2,465,000 | -4,864,000 | 4,386,000 | 5,198,000 | 9,043,000 | 12,986,000 | 7,339,000 | 10,110,000 |
Depreciation And Amortization | 1,214,000 | 1,428,000 | 1,461,000 | 1,561,000 | 1,401,000 | 1,393,000 | 1,582,000 | 1,762,000 | 1,809,000 | 1,706,000 |
Deferred Income Tax | 47,000 | -200,000 | -400,000 | 4,502,000 | 1,976,000 | -309,000 | -245,000 | -138,000 | -1,269,000 | 0 |
Stock Based Compensation | 1,026,000 | 943,000 | 914,000 | 883,000 | 1,037,000 | 1,212,000 | 1,663,000 | 2,031,000 | 2,484,000 | 2,648,000 |
Change In Working Capital | -1,947,000 | -153,000 | 424,000 | 1,460,000 | -1,224,000 | -1,607,000 | -461,000 | -7,800,000 | 1,148,000 | 0 |
Accounts Receivables | 550,000 | -232,000 | -1,104,000 | 734,000 | 1,373,000 | -1,529,000 | 426,000 | -2,066,000 | 2,472,000 | -768,000 |
Inventory | 93,000 | -49,000 | -200,000 | 337,000 | 273,000 | -1,157,000 | -622,000 | -3,137,000 | 8,000 | 13,000 |
Accounts Payables | -908,000 | 541,000 | -45,000 | -94,000 | -443,000 | 907,000 | 495,000 | 1,036,000 | -1,880,000 | 682,000 |
Other Working Capital | -1,682,000 | -413,000 | 1,773,000 | 483,000 | -2,427,000 | 172,000 | -760,000 | -3,633,000 | 548,000 | 0 |
Other Non Cash Items | -102,000 | -320,000 | -171,000 | 353,000 | -290,000 | -73,000 | -1,046,000 | 255,000 | -212,000 | 0 |
Net Cash Provided By Operating Activities | 5,506,000 | 7,400,000 | 4,693,000 | 3,895,000 | 7,286,000 | 5,814,000 | 10,536,000 | 9,096,000 | 11,299,000 | -91,000 |
Investments In Property Plant And Equipment | -994,000 | -539,000 | -690,000 | -784,000 | -887,000 | -1,407,000 | -1,888,000 | -2,262,000 | -1,450,000 | -1,041,000 |
Acquisitions Net | -2,997,000 | -812,000 | -1,544,000 | -326,000 | -252,000 | -185,000 | -1,377,000 | -4,912,000 | -235,000 | -254,000 |
Purchases Of Investments | -16,560,000 | -18,192,000 | -19,772,000 | -5,985,000 | 887,000 | -6,213,000 | -5,907,000 | -1,414,000 | -668,000 | -5,418,000 |
Sales Maturities Of Investments | 16,738,000 | 15,615,000 | 42,421,000 | 9,460,000 | 207,000 | 2,499,000 | 5,875,000 | 2,754,000 | 1,586,000 | 2,677,000 |
Other Investing Activites | 241,000 | 440,000 | -1,952,000 | 2,016,000 | -761,000 | 43,000 | -59,000 | 30,000 | 1,529,000 | 413,000 |
Net Cash Used For Investing Activites | -3,572,000 | -3,488,000 | 18,463,000 | 4,381,000 | -806,000 | -5,263,000 | -3,356,000 | -5,804,000 | 762,000 | -3,623,000 |
Debt Repayment | -3,083,000 | -8,200,000 | -9,309,000 | -16,627,000 | -6,492,000 | -5,065,000 | -2,885,000 | -8,892,000 | -7,012,000 | 0 |
Common Stock Issued | 787,000 | 668,000 | 497,000 | 603,000 | 414,000 | 329,000 | 347,000 | 356,000 | 434,000 | 383,000 |
Common Stock Repurchased | -11,246,000 | -3,923,000 | -1,342,000 | -22,580,000 | -1,793,000 | -2,450,000 | -3,366,000 | -3,129,000 | -2,973,000 | -4,121,000 |
Dividends Paid | -2,880,000 | -2,990,000 | -3,252,000 | -3,466,000 | -2,968,000 | -2,882,000 | -3,008,000 | -3,212,000 | -3,462,000 | -3,687,000 |
Other Financing Activites | 14,161,000 | 8,923,000 | 19,285,000 | 10,583,000 | 4,453,000 | 4,361,000 | 2,114,000 | 7,681,000 | 6,350,000 | -1,844,000 |
Net Cash Used Provided By Financing Activities | -2,261,000 | -5,522,000 | 5,879,000 | -31,487,000 | -6,386,000 | -5,707,000 | -6,798,000 | -7,196,000 | -6,663,000 | -9,269,000 |
Effect Of Forex Changes On Cash | -20,000 | -4,000 | 48,000 | -41,000 | -32,000 | 24,000 | 27,000 | -113,000 | 30,000 | 12,000 |
Net Change In Cash | -347,000 | -1,614,000 | 29,083,000 | -23,252,000 | 62,000 | -5,132,000 | 409,000 | -4,017,000 | 5,428,000 | -678,000 |
Cash At End Of Period | 7,560,000 | 5,946,000 | 35,029,000 | 11,777,000 | 11,839,000 | 6,707,000 | 7,116,000 | 3,099,000 | 8,527,000 | 7,849,000 |
Cash At Beginning Of Period | 7,907,000 | 7,560,000 | 5,946,000 | 35,029,000 | 11,777,000 | 11,839,000 | 6,707,000 | 7,116,000 | 3,099,000 | 8,527,000 |
Operating Cash Flow | 5,506,000 | 7,400,000 | 4,693,000 | 3,895,000 | 7,286,000 | 5,814,000 | 10,536,000 | 9,096,000 | 11,299,000 | -91,000 |
Capital Expenditure | -994,000 | -539,000 | -690,000 | -784,000 | -887,000 | -1,407,000 | -1,888,000 | -2,262,000 | -1,450,000 | -1,041,000 |
Free Cash Flow | 4,512,000 | 6,861,000 | 4,003,000 | 3,111,000 | 6,399,000 | 4,407,000 | 8,648,000 | 6,834,000 | 9,849,000 | -1,132,000 |
Currency | USD | USD | USD | USD | USD | USD | USD | USD | USD | USD |
(* All numbers are in thousands)
Revenue (TTM) : | P/S (TTM) : | 4.65 | ||
Net Income (TTM) : | P/E (TTM) : | 17.92 | ||
Enterprise Value (TTM) : | 187.911B | EV/FCF (TTM) : | 16.84 | |
Dividend Yield (TTM) : | 0.02 | Payout Ratio (TTM) : | 0.36 | |
ROE (TTM) : | 0.41 | ROIC (TTM) : | 0.24 | |
SG&A/Revenue (TTM) : | 0 | R&D/Revenue (TTM) : | 0.23 | |
Net Debt (TTM) : | 38.962B | Debt/Equity (TTM) | 0.56 | P/B (TTM) : | 6.92 | Current Ratio (TTM) : | 2.4 |
Trading Metrics:
Open: | 161.5 | Previous Close: | 163.03 | |
Day Low: | 161.32 | Day High: | 163.86 | |
Year Low: | 128.95 | Year High: | 230.63 | |
Price Avg 50: | 166.77 | Price Avg 200: | 176.44 | |
Volume: | 2.893M | Average Volume: | 8.182M |