Exchange: | NYSE |
Market Cap: | 45.22B |
Shares Outstanding: | 284.674M |
Sector: | Consumer Cyclical | |||||
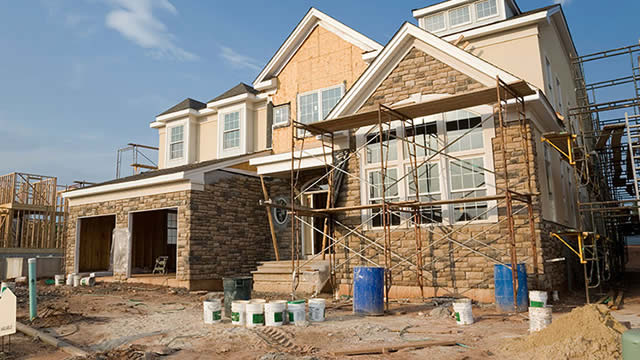
Industry: | Residential Construction | |||||
CEO: | Mr. Stuart A. Miller | |||||
Full Time Employees: | 12284 | |||||
Address: |
|
|||||
Website: | https://www.lennar.com |
Click to read more…
Operator: Thank you for standing by, and welcome to Lennar's Third Quarter Earnings Conference Call. At this time, all participants are in a listen-only mode. After the presentation, we will conduct a question-and-answer session. Today's conference is being recorded. If you have any objections, you may disconnect at this time. I will now turn the call over to David Collins for the reading of the forward-looking statement.
David Collins: Thank you, and good morning, everyone. Today's conference call may include forward-looking statements, including statements regarding Lennar's business, financial condition, results of operations, cash flows, strategies and prospects. Forward-looking statements represent only Lennar's estimates on the date of this conference call and are not intended to give any assurance as to actual future results. Because forward-looking statements relate to matters that have not yet occurred, these statements are inherently subject to risks and uncertainties. Many factors could affect future results and may cause Lennar's actual activities or results to differ materially from the activities and results anticipated in forward-looking statements. These factors include those described in our earnings release and our SEC filings, including those under the caption Risk Factors contained in Lennar's annual report on Form 10-K most recently filed with the SEC. Please note that Lennar assumes no obligation to update any forward-looking statements.
Operator: I would now like to introduce your host, Mr. Stuart Miller, Executive Chairman and Co-CEO. Sir, you may begin.
Stuart Miller: Very good, and good morning, everybody, and thank you for joining today. I'm in Miami today together with Jon Jaffe, our Co CEO and President; Diane Bessette, our Chief Financial Officer; David Collins, who you just heard from, our Controller and Vice President; Bruce Gross -- and Bruce Gross, our CEO of Lennar Financial Services, and a few others are here as well. As usual, I'm going to give a macro and strategic overview of the company. After my introductory remarks, Jon is going to give an operational overview, update in construction costs, cycle time and some of our land strategy and position. As usual, Diane is going to give a detailed financial highlight, along with some limited guidance for our fourth quarter and full year year-end 2024. And then, of course, we'll have question and answer. As usual, I'd like to ask that you please limit yourself to one question, one follow-up so that we can accommodate as many as possible. So, let me go ahead and begin. Overall, the economic environment remains very constructive for homebuilders. Demand remains very strong and the migration to lower interest rates will further activate that demand. Lower interest rates will enhance affordability, which will enable many more families to access and attain homeownership at the entry level, while growing families will be able to unlock value from existing homes, enabling them to move up to more bedrooms and more living space. More listings for existing homes will provide supply of entry-level homes, while driving more demand for move-up product. The dynamic of lower interest rates is likely to accelerate demand for both new and existing homes, while expanding access to homeownership. Of course, affordability has been a limiting factor for demand and access to homeownership to-date. Inflation and interest rates have hindered the ability of average families to accumulate a downpayment or to qualify for mortgage. Higher interest rates have also locked households in lower interest rate mortgages and curtailed the natural move-up as families expand and need more space. Rates buydowns and incentives have enabled demand to access the market to-date. Additionally, across the business landscape, narratives around challenged consumer confidence have peppered earnings calls. Lower rates and controlled inflation will likely boost that confidence. Consumers remain employed. They are generally confident that they will remain employed, and they generally believe that their compensation will rise. This is most often the foundation of a very strong housing market, and we believe that while confidence will ebb and flow, lower rates will stabilize confidence and the consumer will prioritize shelter and purchase as affordability enables them to do so. We firmly believe that lower rates and controlled inflation will build affordability, enabling more households to access either first-time homeownership or move-up purchase. While strong demand, enabled by incentives and mortgage rate buydown, has driven the new home market over the past two years, we fully expect an even stronger and more broad-based demand cycle as rates move lower. While demand has been and should remain strong, the supply of homes remains constrained. The well-documented chronic housing shortage is a result of years of underproduction. This shortage has been exacerbated by continuing shortfalls in production driven by restrictive land permitting and higher impact fees at local levels and higher construction costs across the housing landscape. This week's housing starts print at 1.36 million is a continuation of the shortfall in production that is needed for the current population and immigration, let alone catching up on the shortage. Mayors and governors across the country have become acutely aware of the housing shortage and shortfall in their respective geographies. Many have been pounding the table about the need for affordable housing, attainable housing and workforce housing in their markets. Awareness has begun to give way to the first signs of action and more recently even the national narrative has begun to acknowledge the need for programs that activate supply. Greater supply and greater access to homeownership enables the upward mobility and generational wealth building that has long been associated with building the middle-class through homeownership. It seems that as we begin to focus on solutions, strong demand and strong need will further illuminate the need for supply, and intensified narratives will pave the way to activate greater production. On a final note, immigration has been an additional interesting factor in the housing landscape. On one hand, the influx of immigrant population has expanded the labor pool and, therefore, offset the pressure on construction cost increases. On the other hand, the increase in population requires more supply of dwellings to house that growing population. Without politicizing this issue at this rather sensitive time, the new immigrant population will add to demand, while at the same time help to control production costs. This configuration is an overall positive for the new homebuilders, and it adds to our optimism as we look ahead. Overall, while there will be seasonality, incentives and perhaps some adjustments along the way, we are very optimistic that the road ahead appears very positive for our homebuilding business. Against that backdrop, as you can see from our third quarter results, we are adhering to our operating strategy focused on volume, while we are sprinting towards the completion of our five-year marathon of migrating our operating platform from an asset-heavy model to a land-light, asset-light, just-in-time-finished-home-site-delivery model. We have executed that migration without breaking stride -- without breaking the stride of delivering consistent and growing starts, sales and closing, and while driving the cash flow and bottom-line profitability that market conditions enable. We have literally reorganized the company, while we have operated day to day and quarter to quarter with consistent focus on bottom-line results. I want to emphasize that our North Star has been exactly this focus, on delivering growing volume with consistent cash flow and bottom-line results, while migrating to an asset-light model. This predictable volume and growth has been and will be the key to recasting our business model. First, it has enabled improving operating efficiencies in construction costs, cycle time, consumer -- customer acquisition costs and SG&A. Second, it has driven consistent and dependable cash flow and bottom-line results. And third, it has enabled the consistent and predictable takedown of just-in-time-delivered fully-developed homesites that has attracted capital to the structured land banking partnership that has driven the nearly $20 billion of transactions that have enabled our land-light transformation to-date. Since 2020, when we began our financial and operating transformation, the results and comparisons have been rather dramatic and are worthy of some reflection. Since 2020, when we began this journey, we have reduced our year's supply of land owned from three years' supply to an expected 1.1 year at the end of this year. We have increased our controlled homesites from 43% controlled to 81% controlled expected at the end of the year. And we have increased our inventory turn from under 1 time turn to approximately 1.6 times turn. While our deliveries have gone from approximately 53,000 to a projected 80,500 to 81,000 for a 53% growth rate, our total owned inventory has actually remained flat. We are clearly doing a lot more with a lot less as our return on inventory has grown from 16% in 2020 to a forecasted 30%-plus at year-end this year. But perhaps even more importantly, we have paid down approximately $4.9 billion of debt. By year-end, we will have repurchased approximately 50 million shares of stock for approximately $5.7 billion. And by year-end, we will have distributed approximately $1.9 billion in dividends since 2020. And after all of that, we have a debt to total capital ratio of 7.6%, down from approximately 25% in 2020, and currently we have $4 billion of cash on book. So, how do we do that? Well, first, we consistently adhere to our strategy that starts with the results like our third quarter, focused on growth and volume. And second, we attracted capital with our consistent volume and built capital and operating infrastructure that produces -- that purchases and develops land and delivers fully developed homesites on a just-in-time basis for about one-half of our needed homesites. And now, and third, we will complete this transaction for the other one-half of our land needs and enhance what we have started with our spin-off [Millrose] (ph). Let me break this down. First of all, we are very pleased with our third quarter results as they represent another consistent and strategic quarter of operating results and execution for Lennar. The market for new homes remained consistent with strong demand challenged by affordability. As mortgage rates remained higher around 7% through the first half of our quarter, we added volume with starts, while we incentivized sales to enable affordability as we know that consistent volume and resulting operating efficiencies will continue to attract capital to our asset-light strategy, which will be our greatest strength as interest rates decline. In our third quarter, we increased starts by 8% year-over-year to almost 20,250, we increased new orders by 5% year-over-year to 20,000 -- almost 20,600, and we increased deliveries by 16% year-over-year to just over 21,500. As we have focused on volume, however, we have hit the bump of some communities selling out and closing out faster than expected and others facing entitlement and development delays to expected start dates. As community count fell, we adjusted and pushed volume with greater absorption levels in existing communities, which naturally impacted our margin. We still expect to deliver between 80,500 and 81,000 homes in 2024, more than a 10% increase over 2023. We also expect to continue into 2025 with an expected 10% growth rate as we increased community count somewhat in the third quarter to 1,283 communities and we expect to be above 1,400 communities by the year -- by year-end 2024. We expect the impact of the community count lag to correct over the next couple of quarters. During the quarter, sales incentives rose to just over 10%, as interest rates remained high and we addressed affordability and the community count lag. As an offset, we were able to reduce construction costs and cycle time, and Jon will detail that shortly, and we reduced our customer acquisition cost and our SG&A to 6.7% versus an expected 7.3% as we leveraged our volume to increase efficiencies in our operating platform. While our gross margin came in lower than we expected at 22.5%, our net margin was higher than expected at 15.8%, driven by operating efficiencies, and we ended the quarter with earnings per share, excluding one-time items, of $3.90. As we look ahead to the fourth quarter, given seasonality and customers adjusting to a changing interest rate environment, we expect our gross margin to remain flat as customers build confidence in the changing economic and interest rate landscape. We also expect to see further improvement in our operating efficiencies. As we have driven production pace in sync with sales pace, we have used our margin as a point of adjustment to enable consistent production as market conditions have continued to adjust. Our strategy has enabled us to repurchase another 3.4 million shares of stock for $519 million and end the quarter with $4 billion of cash on book and a 7.6% debt to total capital ratio. We have driven excellent operating results to-date and we continue to be excellently positioned as a company from balance sheet to operating strategy to execution to be able to adjust and address the market as it unfolds for the remainder of 2024 and beyond. So, with the growing -- with the growth and production strategy driving our core business, we embarked on a program to develop a structured and durable land strategies model to systemically purchase and develop land with an option program to purchase fully-developed homesites just in time and as needed. While we had always executed option land deals with third-party developers, and we still do, those deals were not always available and there were simply no developers in many of our markets. We knew that we could only become structurally and durably land-light and asset-light by both negotiating option deals with landowners and developers and also creating structured land option contracts with private equity capital or permanent capital. Our drive to build an asset-light manufacturing model has been a five-year marathon that has required a slow but steady attraction of capital to the concept, supported by an operational plumbing system to support the flow of capital and the delivery of homesites. Additionally, there needed to be a fiduciary for that capital that would oversee the generation of attractive returns to capital at market competitive, risk adjusted returns, while also allowing for appropriate profitability for the manufacturer, namely us. Additionally, the notion of land risk needed to be reconsidered. Not all land has the same risk. Short-term land, which is entitled and mostly developed, is less risky than unentitled farmland. Mixed risk profiles have historically and would always price to the most risky part of the pool. Accordingly, we have worked with a series of private equity partners to create homogeneous risk profile land assets. These assets are priced for their risk profile and are professionally managed through a homesite purchase platform, which we call The Hopper. The Hopper is where land is acquired, held and developed, and ultimately delivered just in time on a rolling option basis with contractually controlled and limited risk to the manufacturer homebuilder as homes are ready to be started. Over time, the management of these land relationships has become second nature to our division management and has actually driven greater efficiency and effectiveness in the management of our land assets. The assignment of risk profile defines the cost of capital. The orchestration of just-in-time delivery of homes becomes as visible and critical as the delivery of lumber and appliances, and the process is becoming increasingly automated for efficiency. But by driving volume through these programs, we have gained advantaged insights into the unique value that these structures are now bringing to the overall company. Aside from the financial improvements outlined earlier, five additional insights immediately come to mind. First, as capital markets become familiar and comfortable with a term based risk, more capital comes to that understood risk and that expands the capital that is available for these types of terms of land. Second, capital markets get comfortable with a particular risk profile and the cost of capital can go down as capital is matched with associated risk. Third, the availability of strategic capital for smaller M&A transactions does not tie up corporate capital while home production is ramped up, and this promotes growth strategies. Fourth, M&A transactions can be absorbed with fewer complicated accounting implications. And fifth, organic growth in existing markets and into new markets can be facilitated with limited balance sheet impact where there's no existing land developers. As I mentioned in our last call, I do want to specifically highlight our unique and very important relationship with TPG Angelo Gordon and Ryan Mollett. We began this journey together back in 2020 and we learned together that we're significantly better for having endured the bumps and bruises of learning and growing. They have come to -- they continue to be our single biggest land partner and we look forward to much more learnings and growing as we grow into the future. Bottom-line, our asset-light land-light strategy is evolving and we are getting better at understanding all the benefits. Finally, in the very near future, the spin-off, which we call Millrose, will generally complete this now almost five-year migration to an asset-light operating model. Not surprisingly, we've received a lot of questions about the planned spin-off we announced during the second quarter earnings call. We're still going through the SEC confidential review process, so I'm limited in what I can say about the spin-off. However, I can tell you a bit -- a little bit about what it will entail and how it will affect Lennar. We have formed a company called Millrose Properties Inc., which we expect to qualify as a Real Estate Investment Trust, or REIT. Millrose will acquire and develop land for Lennar and other homebuilders as -- and will deliver fully-developed homesites under a land option contract. The acquisition, development and delivery of homesites will be similar to other partners -- partnerships that I've just described a little earlier. The REIT structure, however, is unique and will be detailed in the S-11 SEC registration statement when it is made public soon. We are going to contribute to Millrose in exchange for its stock, essentially all of our undeveloped, partially developed and some of our fully developed land along with cash. The stock will be distributed as a stock dividend of Millrose stock to Lennar shareholders and it will accordingly reduce inventory on Lennar's books. That capital, as it cycles within Millrose, will continue to be permanent dependable capital available to Lennar for future land options as further described in the S-11 registration statement when it is made public. Millrose will be responsible for advancing the capital for developing the land contributed, using Lennar as a contractor for consistent execution, and Lennar will have option contracts entitling it to repurchase finished homesites on a just-in-time basis and as needs -- as it needs them for homebuilding activities. Proceeds from the repurchased finished homesite will be reinvested by Millrose in new land and development transactions for Lennar. Additionally, after the spin-off, the new company would be another additive bucket of capital consistent and compatible with other relationships that have existed and will continue to thrive alongside Lennar. Of course, the completion of our spin will drive significantly higher returns on inventory and equity as both inventory and equity are reduced by the amount of assets contributed to Millrose in exchange for stock. Given Lennar's balance sheet strength with a debt to total capital ratio of 7.6%, Lennar's balance sheet will remain very strong after the spin-off with, we believe, consistent earnings and cash flow to continue to pay down debt and repurchase stock. Because Lennar's inventory is constantly changing, we don't know exactly how much land Lennar will contribute to Millrose, but we expect that it will be land and cash with a book value of between $6 billion and $8 billion and we expect that Millrose will seek to enter into land transactions with other builders as well as an independent company. Since the land and cash contributed to Millrose will be debt-free, Millrose will be completely independent as a company with zero Lennar ownership and will be responsible for arranging credit facilities and sources of any debt or equity financing it needs or wants to support its own activities. Lennar will have option purchase arrangements to purchase back finished homesites on a just-in-time basis. Unlike other land companies that rely on land appreciation for returns, Millrose will receive contractual option fees for maintaining options in effect. It will use these fees to pay its expenses and to make regular distributions to stockholders. In addition to option fees, Millrose will also receive the return of invested capital associated with the option exercises. Unlike traditional private equity based land banking funds, Millrose will not be required to distribute or return invested capital to investors. Instead, Millrose will repeatedly reinvest the invested capital as it is returned in future land transactions. Therefore, Millrose will be for Lennar and probably other homebuilders essentially a self-renewing permanent source of land acquisition and development capital. Now, while I'd like to go into more detail about the planned spin-off, as I noted earlier, we're still limited in what we can say until our S-11 SEC registration statement is made public, so more information should become publicly available very soon. So, in conclusion, let me say that this is a very exciting time for Lennar. At Lennar, we're continuing to upgrade the Lennar financial and operating platform as we drive consistent production and sales. Our third quarter 2024 has been another strong, strategic and operational success for our company as we focus on driving consistent volume and growth, adjust community count for that growth, and complete our company's financial and operational restructure. We are, in fact, nearing the end of a five-year marathon that will have restructured our entire operating platform for long-term success and greater returns on capital and equity. We have continued to drive production to meet the housing shortage that we know persists across the market. With that said, as interest rates subside and normalize, and now that the Fed has boldly begin to -- begun to cut rates, we believe that pent-up demand will be activated and we are well-prepared with growing community count and growing volume. Strong pent-up demand has found ways to access the housing market at higher interest rates. As rates drift down, given consistent execution, we are extremely well-positioned for even greater success as strong demand for affordable offerings continues to seek short supply in more affordable interest rate environment. Perhaps most importantly, our strong balance sheet affords us flexibility and opportunity to consider and execute upon thoughtful growth for our future. In that regard, we will focus on our manufacturing model and continue to use our land partnerships to grow with a focus on high returns on capital and equity. We will also continue to focus on our pure-play business model and reduce exposure to non-core assets. We'll continue to drive just-in-time homesite delivery and an asset-light balance sheet, and we'll continue to allocate capital to growth, debt retirement and stock repurchases, as appropriate. As we complete our asset-light transformation, we will continue to execute in the short term, while we return capital to our shareholders through dividend and stock buyback, while we also pursue strategic growth. As we look ahead to completing a successful 2024, we're well-positioned for and expect to see much more of the same in the years ahead. We are confident that by design, we will continue to grow, perform and drive Lennar to new levels of consistent and predictable performance. For now, we are guiding to 22,500 to 23,000 closings next quarter, with a margin that is flat with the third quarter, and we expect to deliver approximately 80,500 to 81,000 homes this year. We also expect to repurchase in excess of $2 billion of stock this year as we continue to drive very strong cash flow. We look forward to a strong finish to 2024. And for that, I want to thank the extraordinary associates of Lennar for their tremendous focus, effort and talent. And with that, let me turn over to Jon.
Jon Jaffe: Good morning. As you heard from Stuart, our operational teams at Lennar continue to focus on executing our operating strategies, while responding in real time to market fluctuations throughout the quarter. This intense focus creates a continuous learning and refinement loop, which in turn continuously improves the execution of these strategies. I will discuss our third quarter performance and cost reduction, cycle time reduction and improved asset-light land position. Our focus on improvement in these areas begins with sales pace. Knowing we can produce a rate of sales by design creates a confidence for the production side of the business. We work on improving the Lennar Machine to produce the needed volume of high-quality leads. This starts at the top of the funnel with testing the effectiveness of targeting through various sources such as SEM or social media and messaging such as rate and payment or lifestyle, all the way through to the ultimate result of a purchase and sale agreement. Every day our divisions learn from their engagement with Lennar Machine constantly adjusting and testing new tactics. This by-design approach drives efficiency and customer acquisition costs, while also improving the customer experience. We utilize incentives and interest rate buydowns as needed to enable us to address affordability and consumer confidence challenges in order to achieve the desired sales pace. This process, against the backdrop of higher interest rates and the impact on consumer from inflation, informed us as to where we needed the buydown of interest rates and/or other incentives to achieve the desired pace. As noted, our third quarter sales pace of 5.5 homes per community per month matched our start pace of 5.4. Achieving the sales pace also resulted in ending the quarter with an average of just more than 1 unsold completed home per community. The resulting confidence from consistently producing the desired sales pace enables planning for an even flow start pace and related production levels. Our goal of the manufacturing process derives from this predictability, which drives improvements in direct construction costs and cycle time. All participants in our operations, trade partners and supply chain partners benefit from the combination of this predictability along with our high volume. This manufacturing approach along with the maximized efficiencies of our [indiscernible] strategy will allow us to continue to drive down cost and cycle time into 2025. In the third quarter, our construction cost decreased sequentially from Q2 by over 1% and on a year-over-year basis by over 6%. Accomplishing a 6% cost reduction during the inflationary environment of the past year demonstrates the effectiveness of our strategy and affirms the benefits of our builder-of-choice approach. This manufacturing strategy resulted in continued significant gains in cycle time. In our third quarter, cycle time decreased by 10 days sequentially from Q2 down to 140 calendar days on average for single family homes, which is a 23% decrease year-over-year and a material contributor to our inventory churn improvement. Next, I'll discuss the execution of our land-light strategy. In the third quarter, we continued to effectively work with our strategic land developers and landbank partners, where they purchased land on our behalf and then delivered just-in-time finished homesites to our homebuilding machine. In the third quarter, about 82% of our $2 billion or approximately 17,000 homesites acquired in the quarter were finished homesites purchased from these various land structures. During the quarter, our landbanks acquired on our behalf about 15,000 homesites for around $800 million in land acquisition and a commitment of about $650 million in land development. With this focus on being asset-light, our supply of owned homesites decreased to 1.1 years down from 1.5 years and controlled homesite percentage increased to 81% from 73% year-over-year. These improvements in the execution of our operating strategies enable reduced cycle time and less land owned resulting in improved inventory churn, which now stands at 1.6 versus 1.4 last year, a 14% increase. As in prior quarters, the third quarter showed continued progress in execution of each of these strategies that Stuart and I reviewed. We started with a focus on Lennar marketing and sales machine, leading to even flow manufacturing-light production and asset-light land strategies. We focused on improving and connecting these strategies together driving even more consistency and improvement. In our third quarter, as interest rates fluctuated and consumers felt the pressure of inflation, we managed nimbly with the aid of new technology-driven tools in the form of real-time data dashboards. The consistent digestion and critical review of the data allows for quick action and improved execution. I want to add my thanks to the associates for their commitment to implementing and executing these strategies. Now, I'd like to turn it over to Diane.
Diane Bessette: Thank you, Jon, and good morning, everyone. So, Stuart and Jon have provided a great deal of color regarding our homebuilding performance. So, therefore, I'm going to spend a few minutes on the results of our other business segments, pull together again our balance sheet highlights and then provide guidance for Q4. So, starting with Financial Services. For the third quarter, our Financial Services team had operating earnings of $144 million. These earnings were fairly consistent with the prior year. While we had lower lock volume and net secondary margins in our mortgage business, this was partially offset by higher delivery volume and lower cost in our title business. Our Financial Services team is intensely dedicated to providing a great customer experience for each homebuyer and has created true partnerships with our homebuilding teams to accomplish that goal. That partnership is reflected in their solid results. Moving into Multifamily, for the quarter, our Multifamily segment had operating earnings of $79 million. The primary driver of earnings was the gain on sale of assets in our LMV Fund I. As we noted last quarter, we are under contract to sell the assets to multiple buyers. In the third quarter, we closed about 70% of the anticipated sales. We recorded a net gain of $179 million and received about $140 million of cash. We expect most of the remaining assets to be sold in the fourth quarter. A second component for the quarter was a $90 million write-down of non-core assets that are held on book as we focus on immediately monetizing these assets. This is consistent with our pure-play asset-light strategy and with the ultimate goal of increasing returns. So, turning to the balance sheet, this quarter, once again, we adhered to our strategy of maximizing return on inventory by turning our inventory at the appropriate market -- margin. The results of these actions was that we drove cash flow and ended the quarter with $4 billion of cash and no borrowings on our $2.2 billion revolving credit facility. This provided total liquidity of $6.2 billion. As a result of our continued focus on balance sheet efficiency and reducing our capital investment, we, once again, made significant progress on our goal of becoming land-light. As Jon mentioned, at quarter-end, our years owned improved to 1.1 years from 1.5 years in the prior year and our homesites controlled increased to 81% from 73% in the prior year, our lowest years owned and highest controlled percentage in our history. At quarter-end, we owned 87,000 homesites and controlled 369,000 homesites for a total of 456,000 homesites. We believe this portfolio provides us with a strong competitive position to continue to grow market share in a capital efficient way. We spent $2 billion on land purchases this quarter. However, over 80% were finished homesites where vertical construction will soon begin. This is consistent with our manufacturing model of buying land on a just-in-time basis, which is less capital intensive. Of the homes closed during the quarter, approximately 64% were from our third-party land structures when we purchased those homesites on a finished basis. As we continue to reduce our ownership in land and purchase homesites on a just-in-time basis, our earnings should more consistently approximate cash flow and, over time, it would be our goal to align capital return to shareholders more closely with that cash flow. And finally, our inventory turn was 1.6 times, up from 1.4 times last year, and our return on inventory was 31.3%, up 324 basis points from last year. During the quarter and consistent with our production focus, we started about 20,200 homes and ended the quarter with about 40,000 homes in inventory. This inventory number includes approximately [1,750] (ph) homes that were completed unsold, which is slightly more than one home per community as we successfully managed our finished inventory levels. Looking at our debt maturity profile, we had no redemption or repurchases of senior notes this quarter. Our next debt maturity is not until May of 2025. We continue to benefit from our previous paydowns of senior notes and strong earnings generation which brought our debt to total capital down to 7.6% at quarter-end, our lowest ever and a strong improvement from 11.5% in the prior year. The significant decrease in leverage is one of the factors that allowed us to receive an upgrade in our debt ratings from Fitch from BBB to BBB+. We are pleased to achieve this accomplishment that recognizes the strength of our balance sheet and our operating platform. Consistent with our commitment to increasing shareholder returns, we repurchased 3.4 million of our outstanding shares for $519 million. Additionally, we paid total dividends this quarter of $136 million. Finally, our stockholders' equity increased to over $27 billion, and our book value per share increased to just over $101. In summary, the strength of our balance sheet, strong liquidity and low leverage provides us with significant confidence and financial flexibility as we move through the remainder of 2024 and beyond. So, with that brief overview, I'd like to turn to Q4 and provide some guidance estimates. Starting with new orders. We expect Q4 new orders to be in the range of 19,000 to 19,300 homes, which approximates a 10% year-over-year growth. We also expect our year-end community count to be about 10% to 12% greater than last year. We anticipate our Q4 deliveries to be in the range of 22,500 to 23,000 homes with a continued manufacturing focus on turning inventory into cash. Our Q4 average sales price on those deliveries should be about $425,000, as we continue to price the market to reach affordability. We expect gross margins to be flat with Q3, and our SG&A to be in the range of 6.7% to 6.8%, with both estimates dependent on market conditions. For the combined homebuilding joint venture land sales and other categories, we expect to generate earnings of about $25 million. We anticipate our Financial Services earnings to be approximately $140 million, and we expect to be about breakeven in our Multifamily business. Turning to Lennar Other, we expect a loss of about $5 million, excluding the impact of any potential mark-to-market adjustment to our public technology investment. Our Q4 corporate G&A should be about 1.7% of total revenues, and our charitable foundation contribution will be based on $1,000 per home delivered. We expect our Q4 tax rate to be approximately 24.25%, and the weighted average share count should be approximately 267 million shares. And so, on a combined basis, these estimates should produce an EPS range of approximately $4.10 to $4.25 per share for the quarter. And also, we also remain confident with our cash flow generation. As such, as Stuart mentioned, we are still targeting a minimum of $2 billion of share repurchases for fiscal 2024. And with that, let me turn it over to the operator.
Operator: Thank you. At this time, we will begin our question-and-answer session. [Operator Instructions] Our first question comes from Alan Ratner with Zelman & Associates. Your line is open.
Alan Ratner: Hey, guys. Good morning. Wow, thank you for all of that detail. Still digesting everything, Stuart, but sounds like you guys have definitely been busy and...
Stuart Miller: It's a lot to take in, no questions.
Alan Ratner: Yeah. So, I guess, recognizing you might be limited on what you could say on Millrose, just because you gave some color there, I'll start on that front. I'm curious as you kind of went through this process or are going through the process and maybe comparing and contrasting the various structures you've had over the years on the land side and kind of come up with how you envision Millrose is going forward, I think one of the things you mentioned that sounds a little bit different is just kind of like the fees that the business or the company will earn on these option deals. And I'm curious from your perspective as the manufacturer and as the builder, what margin impact would you expect that to have relative to the current land banking structures you currently have? Is it going to be materially different? It sounds like it might be more beneficial to Millrose or at least more predictable to them, if you will, but I might be misinterpreting that.
Stuart Miller: So, within the boundaries of what I can and can't say, let me say it this way, Alan. It's a good question. So, what I tried to detail in my comments is that think about Millrose as being a mirror image of our other structures. The single biggest differential is the capital component, which is a permanent capital structure versus one where the capital has to be raised repeatedly. So, we structured this as a REIT, as I said, and it's structured through it being a public company as permanent capital that does where the capital itself does not get returned. But aside from that, as we look at what we have done with our -- with the first half, let's say, it's more or less half, of our developed homesites that have been used in production as we've migrated over the past years, we expect that the impact will be basically similar. And it's been a relatively small impact on our margin as we have absorbed option costs, which exist in all of those relationships. And we have included or benefited from efficiencies that have come from the way that we've managed land and the way that we're managing our overall business. Now, can I point to specifics as how the offsets actually happen? It's not quite that linear, but we think that the impact is going to be relatively small.
Alan Ratner: Got it. I appreciate that, and that's helpful. So, looking forward to seeing it all unfold. Second, just on the gross margin, I'm sure you're expecting lots of questions on this, but relative to where you were three months ago, six months ago, kind of expecting more of a ramp this year as opposed to now more of kind of flattish through the year on gross margin, just curious what, I guess, surprised you relative to what you would have expected three months ago. Because it doesn't seem -- if anything, rates have come down about 100 basis points since June. It seems like August was a pretty decent month based on some of the macro data and commentary from other builders. Yet, you are expecting a lower margin in Q4 than you maybe articulated three months ago. So, what was the main driver for that revised outlook?
Stuart Miller: Well, first of all, let's say, let's start by recognizing that really rates did not start coming down until later into our quarter. For the first half or more of the quarter, rates were kind of sticky up at a 7% kind of range. And that cast a pretty tough affordability cloud on what was happening in the market. And consumer confidence has been slow to kind of kick in as rates have kind of fallen over the second part of the quarter. So, I think that stickiness has kind of been a differentiating factor and that's market driven. I think that there is the confluence within our environment of managing the relationship between our reduced cycle times and the fall off of community and community count and some communities not coming on as quickly as we had hoped. And that driving, in our world, a need -- given our drive to volume and growth, our need and desire to keep the volume up at a time when interest rates are high, consumer confidence hasn't really kicked in and our community count kind of falls, increasing our absorption rates. So, that's what's kind of come as a differentiating fact as we have continued to migrate towards our restructuring. And maybe that's what's different between us and others is that we're focused on keeping that volume up, so that we can facilitate where we're headed and to a program that we think is going to put us in much better stead for the future and that's driven us forward to drive volume at a time when interest rates are high, consumer confidence has been waning a little bit and our community count dropped a little bit. We think that's self-correcting over the next quarters, and we think it's solving to a greater good.
Alan Ratner: Appreciate it. Thanks for all the info.
Operator: Thank you. Our next question comes from Stephen Kim with Evercore ISI. Your line is open.
Stephen Kim: Yeah, thanks a lot guys. It's obvious you've been busy this summer. So, I appreciate all the information you've given so far. I wanted to piggyback a little bit on your most recent answer to Alan. With respect to volume growth, I know you're guiding to 10% volume growth next year, but I think you just sort of indicated that some of this is in an effort to make sure that you progress towards your restructuring in as helpful a manner or in a smooth a manner as you can. So, maintaining volume maybe when others tweak to down their volume can be explained in a way near term and in this past quarter by the fact that you're progressing towards this Millrose REIT, the launching of that REIT. So, my question relates to the longer term. If we move beyond, when you've -- let's say, you've accomplished your goals with Millrose, longer-term, others in the industry have seemingly been moderating their long-term targets to more of a 5% to 10% volume range. And I'm curious, can you talk about what you think is the proper long-term rate of growth for Lennar, longer term that is. And is that dependent upon a certain rate of national housing starts growth or mortgage rates staying below a certain level or something like that? Just kind of give us a sense for long term where you think volume growth should be.
Stuart Miller: So, right now, we're kind of solving to a 10% steady state growth rate. And part of that, Steve, relates to our view of what our land strategy has become. The more we are focused on our asset-light model, the more we are seeing that we can dovetail a combination of organic growth and strategic new market growth that is facilitated by the structure of the way that our operations will be configured as we go forward. So, we're kind of looking at more of a steady state 10%. Now, this kind of dovetails with what we think has to happen in terms of building a healthier housing market. Remember that, nationally, we're supply constrained. At local markets, there's supply constrained. And the market is going to need additional supply of homes, particularly as interest rates drift down, particularly as at the local and at the national level, the world focuses on greater volume and greater supply to accommodate the population as it sits right now. Now, we're seeing and hearing that narrative come across pretty loudly even at the national level. And we think that we're positioned to dovetail with what has to be a growth in production levels. And I don't know what new normal is. The print more recently was 1.36 million. That seems light, and it doesn't seem like we're catching up on the supply side. So, we're building a model that we think facilitates our ability to participate in growing a healthier housing market, which means greater supply, accommodating the demand that is pent-up and limited by affordability.
Stephen Kim: Okay. Yeah, that's fair enough. Appreciate that. The second half of my question relates to operating margins. I think that maybe the story for some investors this quarter was that you made a -- you brought the trade-off between volume and margin a little bit more into sharper relief. And so, with respect to the operating margin, and I'm talking about your operating margin after corporate expense, it seems based on your guidance that you're going to be coming in somewhere a little north of 13% this year, which is quite a bit below some of your bigger cap peers. And I'm curious if you could share why you think this is the case and whether this level is in-line with where you think your operating profitability is going to be over the long term. Yeah, I guess, we'll stop there.
Stuart Miller: So, I think you started by saying it sounds like we had a busy summer. In actual fact, the biggest part of the busy summer has been focused on the operations and efficiencies that we inject as we migrate our business to asset-light, but more importantly, as we grow volume using that volume to build efficiencies in the way that we execute and drive a net margin, an operating margin that can -- that starts to grow into where we're headed as an operating model. So, I can't lay out the pathway to where we're going in specificity, but I think that we believe, I know that we believe that our operating margins are going to grow as we go forward. And as we settle into what becomes a normalized full-bodied asset-light approach rather than the building of the approach actually executing it will enable us to get more and more efficient.
Stephen Kim: Okay. Well, great. We'll be waiting for that, but appreciate all the color in the meantime. Thanks, guys.
Stuart Miller: Very good. Thanks.
Operator: Thank you. Our next question comes from Susan Maklari with Goldman Sachs. Your line is open.
Susan Maklari: Yes. Thank you, everyone. Thanks for taking the questions. My first question is, Stuart, given the commentary that you gave around the strategic shift that's coming through as well as Jon's comments on the operational improvements that you're focused on, can you talk a bit about the upside to those inventory turns, which obviously moved really nicely this quarter already, and what that means for the cash generation of the business as we think about the next year?
Stuart Miller: Well, we've seen this kick in over these past few years. And that is as we improve our inventory turn, it just accelerates our cash flow and enables us to be far more efficient in the way that we run our business. Now, creating these efficiencies and embedding them in 40 divisions across the country right now, it takes a little bit of time to get all of these things operating in a consistent flow through all the divisions, but division by division, that's exactly what we're doing, focusing on that inventory turn. And we think, over time, it will trend significantly higher than it is right now. Part of the time that it takes to get there is that we've only affected about half of our delivery system at this point. And as we get more proficient with a full-bodied approach to an asset-light approach, we think that that inventory turn is going to continue to climb.
Diane Bessette: And, Susan, I would just add just to think about it simplistically, as we've said, the goal really is to have our cash flow generation equal our net earnings. And as you think about the usage of that cash, our debt maturity ladder, that definitely been reducing with our paydowns and not refinancing, so that leaves a fair amount of cash to be deployed back into shareholders.
Susan Maklari: Yes. Okay. And building on that, perhaps, you did end the quarter, you had $4 billion of cash on the balance sheet, how are you thinking about the amount of cash that you need to hold going forward given the strategy that you'll be operating under and the uses of that extra cash?
Stuart Miller: So, as I've said in past calls, one of the big questions from many of our investors and analysts has been, aren't you carrying a little bit more cash or maybe even materially more cash than you need? And we've said that we are carrying that as we evolve our business program and think about exactly what the configuration of Millrose is going to look like. I know it seems like we've been taking a lot of time on this. This is hard work and harder than some might think getting this configuration right actually is. So, the cash that we're holding is what I would call safety stock relative to cash in terms of defining exactly what we're spinning off, because it is a moving target, exactly what we're spinning off and what component of cash actually goes into Millrose as well. And that is a matter of strategy that we'll discuss further as we file our S-11 in a public format in the near future and as we have further conversations. So, I just have to say, it's kind of trust me right now. We're holding the cash right now as safety stock. It's not needed for the operations of the business, but it is needed for consideration as to how we move forward.
Susan Maklari: Yeah. Okay. I appreciate that color. Thank you, and good luck with everything.
Stuart Miller: Okay. Thank you.
Operator: Thank you. Our next question comes from Michael Rehaut with JPMorgan. Your line is open.
Stuart Miller: Good morning, Mike.
Michael Rehaut: Good afternoon, Stuart.
Stuart Miller: Right. Did it switch over? Yeah.
Michael Rehaut: So, wanted to delve in a little bit more on the land spin. I know, obviously, you remain a little limited on fully what you can say, but I think there's a lot of devil in the details here that we will be interested in trying to gauge. You talked about, I think, last quarter $6 billion to $8 billion of land. I think the language this quarter was $6 billion to $8 billion of land and cash. Was hoping to get any kind of rough sense of how much of the cash portion of that would -- the cash portion would represent. Also roughly the stock received in exchange, if there's any kind of, again, range or degree of magnitude that we should think about? And lastly, if it would affect your cost structure at all by spinning off all of these assets, I don't know, if there's also any associated personnel that might result in a reduction of corporate G&A or your SG&A?
Stuart Miller: Okay. So, let me start by saying that the words that we would spend $6 billion to $8 billion of land versus $6 billion to $8 billion of land and cash might have been a foot fault on my part. It really hasn't changed. The notion has not changed from quarter-to-quarter. It was always that there would be a cash component, and exactly what that is -- as I said, it's moving around. Remember that we're contributing to Millrose, a moving set of assets that are constantly some coming in, some going out on a rotating basis. And that's where -- until we kind of get to the end, we won't know exactly what the numbers are. There's also a strategic component of how we're configuring Millrose, but again, that falls into the category of what I can't talk about. You might have noticed that our discussion has been almost exclusively on impacts to Lennar rather than too much information on the configuration of Millrose. So, I can't quite go there yet, but this is going to come to market pretty soon. So, I just would say be patient on that. And I think that a lot of the rest of your question falls into that category as well. There will be very limited personnel movement relative to Millrose. So, the impact to Lennar on SG&A will only be in the context of efficiencies in how we run our business, not in terms of personnel migrating outside of the Lennar environment.
Diane Bessette: And, Mike, just one clarification, it sounded like there might be a little confusion. As we contribute our assets to Millrose, that will be in exchange for Millrose stock, but Lennar will not be holding that Millrose stock, that will be stock dividend that is distributed to our shareholders. So, it sounds like there might be a little confusion on that, just wanted to clarify.
Michael Rehaut: Okay. No, that's very helpful. I appreciate that. Secondly, again, I just wasn't fully, I guess, kind of appreciate maybe the answer earlier on the gross margin question around -- last quarter, kind of the arrows were pointing closer to 25% or so. Now, you're looking at closer to 22.5%. And just wanted to better appreciate, again, kind of what's changed in the last 90 days. And you kind of alluded to a couple of different factors. I don't want to put words in your mouth, but seemingly a pretty different degree of magnitude shift here. And if this is also something that is more temporary given some of the factors perhaps around Millrose relative to kind of initially at least how we should think about fiscal '25 on the ongoing business?
Stuart Miller: Yeah. I think as I've said, all of this kind of melts into one kind of articulation, and that is our margin story derives from, number one, interest rates staying higher for a little bit longer through this quarter. Consumer confidence kind of waning. We've heard this in a lot of conference calls. Even as interest rates have come down, the consumer has been a little sticky in terms of -- they're jumping back into the housing market. And the changes in community count driving at a time when demand has been limited by affordability. And then, pushing volume by increasing absorption rates within communities has kind of pushed our margin. And we said clearly in our last earnings call that, look, we're going to focus on volume, generating a consistent volume and growth trajectory. And we are going to use our margin as that shock absorber. And the confluence of these pieces together with the spin-off and the asset-light approach that we've taken has reflected exactly that way. And we've been irreverent about using our margin to make sure that we're maintaining the volume and projecting to where we think the long-term benefit is for the company.
Michael Rehaut: Okay. Appreciate it. Thank you.
Stuart Miller: Okay. You bet.
Operator: Thank you. Our next question comes from Trevor Allinson with Wolfe Research. Your line is open.
Stuart Miller: Good morning.
Trevor Allinson: Hey, good afternoon. Thank you for taking my questions. I want to follow up on SG&A. You had really good SG&A control in the quarter. It sounds like some of your internal efficiencies are driving tangible results. You called out the technology benefits. You also mentioned in your press release lower broker costs driving the SG&A. The NAR settlement just went into effect not long ago. So, I was hoping you could talk about maybe some of the changes you're making with brokers, if any, whether that's moving more to a flat fee, adjusting the rate you're paying, any net impact from those, and then perhaps maybe your views more generally on broker usage.
Stuart Miller: Yeah. A number of people have asked us about our strategy relative to realtors. I put this under the heading of building a healthier housing market. Our focus has been on trying to take out as many unnecessary costs from the housing transaction in order to build affordability for our customers. Realtors, we have a great respect for the realtors. They bring us business. And we cooperate and work with realtors, but at the same time, we've been focused on bringing down that realtor cost where it is not necessary because, conceptually, it just adds to the cost of the home. And to the extent that we can repurpose that where a realtor really isn't involved, to bring down the cost of the home for customers, we think we're building a better housing market. If you look at our production, our volume, we are able -- with a more robust marketing program -- digital marketing program, we are able to maintain our volumes and accommodate a lower-priced home for our customer. So, we've been working with realtors to come up with plans that actually worked for their clients, where they are engaged, and at the same time, trying to maintain and bring down the cost of the home for the customer.
Trevor Allinson: Okay. Makes a lot of sense. And then, just given where we are in the election cycle, housing has clearly gotten a lot of attention politically recently. Stuart, I think you alluded to some of the proposals on the supply side, but there's also a proposal for buyers in terms of downpayment assistance. I was hoping just to get your thoughts on the down assistance proposal. Are you still seeing down payments as a key headwind to homeownership or is it primarily DTIs? And then, what are your views on potential demand impact if that were to eventually go into place? Thanks.
Stuart Miller: Great question. Inflation has been a difficult component in enabling our customer base to accumulate a downpayment. And there's no question that the downpayment is a hurdle and has been and continues to be a hurdle for customers looking to acquire specifically a first home. Whether it's attainable housing or affordable housing, the downpayment is definitely a hurdle. I think that the -- there are a lot of thoughts and programs out there. We'll see where they shake out. I think there's a tightrope that has to be walked. Number one, we've got to remember back to the Great Recession, we certainly don't want to get to that "no downpayment" kind of programming. It might feel good for a short period of time, but we want a durable housing market. I think we also have to think about inflationary pressures, to the balance between additional supply and additional demand is something that's going to have to be walked through. What has me most invigorated is the fact that what we've been hearing from mayors and governors, and talking to mayors and governors for a very long time, is now starting to reflect in the national narrative. And the fact that the nuanced programs are not perfected yet, but the discussion is starting to activate thinking as to how do we get better and build a healthier housing market is going to inure to the benefit of our housing business.
Trevor Allinson: All right. Thank you. I appreciate your views. Good luck moving forward.
Stuart Miller: Okay. And why don't we take one more question?
Operator: Okay. And our last question comes from John Lovallo with UBS. Your line is open.
John Lovallo: Hey, guys. Thanks for fitting me in here. I wanted to actually dovetail off of Trevor's question to start. SG&A as a percentage of sales was 70 basis points below the midpoint of your outlook, on a slight revenue beat versus your expectations. You talked about pulling back on brokers, but was that pullback on brokers incremental? Is that what the driver was? And the lack of broker use for -- I guess, one way to say it is, the lack of broker use relative to some of your competitors, does that mean that fewer folks are coming through your communities, and because of that, you need more incentives to drive that volume that you're looking to keep? I mean, are you taking costs out of one bucket and put it into another, is the simple way of putting it.
Stuart Miller: So, good question, and one that we think about a lot. It is counterintuitive to us that -- first of all, we have not seen a reduction in our traffic. And what we're doing is not something that's new. This is basically a program that we've had in place for a very long time relative to what we call the Machine, the digital marketing programming, and the way that we're executing our marketing and sales program. So, our realtor costs have been migrating downward. It has not been a reduction in traffic or people coming through our offices. It's counterintuitive to us that, by adding a cost, we would also be adding a pricing power. And it's probably just not the way that we think about building a healthier housing market. To the extent that a realtor is actively involved in becoming a procuring cause and finding a customer and bringing them to us, we want to pay appropriately and participate with the realtor community. On the other hand, there's an awful lot of realtor engagement that is kind of ancillary to the active engagement. We try to bleed that out of the system because we are trying to reduce cost. Are we taking it from a more active realtor engagement and putting it into incentives? I guess, I'd like to say that I think -- I hope the answer is kind of yes, but I don't think it's greater incentives outsized relative to the realtor costs that we're saving. And I'd like to think that if we're taking cost out, we're actually able to sell at a lower price and still produce a better margin. So, we're still working with that. It's a tough balance, it's a complicated balance, and it's something that we focus on, frankly, every day. And most definitely, as Jon and I go out to our operations reviews, it's something that we're very close to and watch regularly.
John Lovallo: Okay. That's helpful color. And then, the last one is, as you mentioned, REITs have to distribute the vast majority of their income to shareholders. So, I'm curious sort of what the pros and cons of a REIT structure for the spin would be. And the reason I ask is, why don't private landbank structure themselves like REITs? I mean, is this going to limit the ability to grow with Lennar if it has to distribute the earnings?
Stuart Miller: Well, as I noted, we've had to focus our discussion on -- around Millrose as it relates to the impacts on Lennar rather than the explicit discussion of how the Millrose structure will actually work. We're going to have to wait on that one, for the filing of the S-11. I think it is a unique structure. And every good book is worth waiting until the next chapter, so you're just going to have to wait for the next chapter. And I appreciate the question.
John Lovallo: All right. Thank you, guys. Good luck.
Stuart Miller: Okay. Thanks very much. And as always, we appreciate everyone's attention. Thanks for joining our earnings call, and we look forward to continuing to describe, detail our progress as we move forward. We'll see you at the end of the year.
Operator: Thank you. And that concludes today's conference. You may all disconnect at this time.
Subscribe now to gain full access to the earnings summary, 5 years analyst estimates and more exclusive content.
Subscribe NowWARNING: AI-generated summary.
While this is a phenomenal tool that can save you time and provide meaningful insights and key takeaways from the earnings call, it may contain inaccuracies or misinterpretations. For precise information, please refer to the original transcript.
(* All numbers are in thousands)
Fiscal Year | 2014 | 2015 | 2016 | 2017 | 2018 | 2019 | 2020 | 2021 | 2022 | 2023 |
---|---|---|---|---|---|---|---|---|---|---|
Revenue | 7,779,812 | 9,474,008 | 10,949,999 | 12,646,365 | 20,571,631 | 22,259,561 | 22,488,854 | 27,130,676 | 33,671,010 | 34,233,366 |
Cost Of Revenue | 5,965,790 | 7,340,698 | 8,556,157 | 11,021,481 | 16,629,282 | 17,742,081 | 19,006,648 | 20,853,412 | 23,197,056 | 249,022 |
Gross Profit | 1,814,022 | 2,133,310 | 2,393,842 | 1,624,884 | 3,942,349 | 4,517,480 | 3,482,206 | 6,277,264 | 10,473,954 | 33,984,344 |
Research And Development Expenses | 0 | 0 | 0 | 0 | 0 | 0 | 0 | 0 | 0 | 0 |
General And Administrative Expenses | 891,984 | 1,047,294 | 1,131,479 | 285,889 | 1,952,098 | 2,056,299 | 358,418 | 398,381 | 2,378,741 | 501,338 |
Selling And Marketing Expenses | 0 | 0 | 0 | 0 | 0 | 0 | 0 | 0 | 0 | 2,231,033 |
Selling General And Administrative Expenses | 891,984 | 1,047,294 | 1,131,479 | 285,889 | 1,952,098 | 2,056,299 | 358,418 | 398,381 | 2,378,741 | 501,338 |
Other Expenses | 10,921 | 30,870 | 17,527 | 8,347 | 143,783 | -40,282 | -16,980 | -59,825 | 1,270,793 | -42,570 |
Operating Expenses | 891,984 | 1,047,294 | 1,131,479 | 285,889 | 1,952,098 | 2,056,299 | 358,418 | 398,381 | 3,649,534 | 501,338 |
Cost And Expenses | 6,857,774 | 8,387,992 | 9,687,636 | 11,307,370 | 18,581,380 | 19,798,380 | 19,365,066 | 21,251,793 | 26,846,590 | 750,360 |
Interest Income | 0 | 0 | 0 | 0 | 0 | 17,620 | 22,401 | 20,142 | 34,376 | 0 |
Interest Expense | 36,551 | 12,454 | 4,626 | 7,164 | 11,258 | 17,620 | 22,401 | 365,373 | 1,478,648 | 257,893 |
Depreciation And Amortization | 38,542 | 43,666 | 50,219 | 66,324 | 91,181 | 92,200 | 94,553 | 85,954 | 87,075 | 110,164 |
EBITDA | 1,006,335 | 1,222,070 | 1,335,095 | 1,475,500 | 1,846,824 | 2,461,181 | 3,123,788 | 5,878,883 | 7,545,913 | 5,527,707 |
Operating Income | 885,487 | 1,073,562 | 1,257,737 | 1,475,500 | 1,755,643 | 2,368,981 | 3,029,235 | 5,792,929 | 7,458,838 | 5,527,707 |
Total Other Income Expenses Net | 84,297 | 136,054 | 72,732 | -142,220 | 507,041 | 65,311 | 94,553 | 26,129 | -1,444,272 | -325,403 |
income Before Tax | 969,784 | 1,209,616 | 1,330,469 | 1,189,611 | 2,262,684 | 2,434,292 | 3,123,788 | 5,819,058 | 6,014,566 | 5,202,304 |
Income Tax Expense | 341,091 | 390,416 | 417,378 | 417,857 | 545,171 | 592,173 | 656,235 | 1,362,509 | 1,366,065 | 1,241,013 |
Net Income | 638,916 | 802,894 | 911,844 | 810,480 | 1,695,831 | 1,849,052 | 2,465,036 | 4,430,111 | 4,614,125 | 3,938,511 |
Eps | 3.060 | 3.790 | 4.050 | 3.380 | 5.510 | 5.760 | 7.880 | 14.280 | 15.740 | 13.730 |
Eps Diluted | 2.750 | 3.390 | 3.850 | 3.380 | 5.500 | 5.740 | 7.850 | 14.270 | 15.720 | 13.730 |
Weighted Average Shares Outstanding | 206,253.180 | 209,292.780 | 222,789.420 | 237,155 | 307,968 | 318,419 | 309,406 | 306,612 | 289,824 | 283,319 |
Weighted Average Shares Outstanding Diluted | 232,804.800 | 235,428.240 | 235,326.240 | 237,156 | 308,565 | 318,422 | 309,407 | 306,612 | 289,824 | 283,319 |
Currency | USD | USD | USD | USD | USD | USD | USD | USD | USD | USD |
(* All numbers are in thousands)
Fiscal Year | 2014 | 2015 | 2016 | 2017 | 2018 | 2019 | 2020 | 2021 | 2022 | 2023 |
---|---|---|---|---|---|---|---|---|---|---|
Cash And Cash Equivalents | 1,191,804 | 1,051,667.999 | 1,205,565 | 2,533,462 | 1,369,973 | 1,211,883 | 2,746,867 | 2,754,723 | 4,639,342 | 6,315,006 |
Short Term Investments | 0 | 0 | 0 | 0 | 0 | 0 | 0 | 0 | 1,733,725 | 2,002,154 |
Cash And Short Term Investments | 1,191,804 | 1,051,667.999 | 1,205,565 | 2,533,462 | 1,369,973 | 1,211,883 | 2,746,867 | 2,754,723 | 6,373,067 | 8,317,160 |
Net Receivables | 195,271 | 229,981 | 330,635 | 126,743 | 186,874 | 202,800 | 217,391 | 340,878 | 602,375 | 730,060 |
Inventory | 7,862,774 | 8,862,086 | 9,318,639 | 11,069,508 | 17,346,598 | 18,091,614 | 17,175,148 | 19,169,397 | 20,099,905 | 18,897,670 |
Other Current Assets | 1,579,191.999 | 1,983,253 | 1,850,971.999 | 1,783,803 | 2,381,472.999 | 2,695,990.999 | 2,469,281.999 | 2,837,862.999 | 3,010,277 | 3,364,349 |
Total Current Assets | 10,829,041 | 12,126,988 | 12,705,811 | 15,513,516 | 21,284,918 | 22,202,288 | 22,608,688 | 25,102,861 | 30,085,624 | 31,309,239 |
Property Plant Equipment Net | 158,904 | 115,557 | 173,614 | 215,068 | 319,861 | 279,527 | 411,518 | 339,906 | 355,095 | 404,789 |
Goodwill | 0 | 0 | 0 | 136,566 | 3,442,359 | 3,442,359 | 3,442,359 | 3,442,359 | 3,442,359 | 3,442,359 |
Intangible Assets | 0 | 0 | 0 | 0 | 0 | 0 | 0 | 0 | 0 | 0 |
Goodwill And Intangible Assets | 0 | 0 | 0 | 136,566 | 3,442,359 | 3,442,359 | 3,442,359 | 3,442,359 | 3,442,359 | 3,442,359 |
Long Term Investments | 955,981 | 1,242,921 | 1,447,283 | 1,753,390 | 1,835,408 | 2,076,235.999 | 2,187,189 | 3,020,636 | 2,564,321 | 2,355,201 |
Tax Assets | 0 | 0 | 0 | 0 | 0 | 0 | 0 | 0 | 0 | 0 |
Other Non Current Assets | 979,225 | 934,043 | 1,035,073 | 1,126,494 | 1,683,635 | 1,359,101.001 | 1,285,423 | 1,302,016 | 1,536,896 | 1,722,715 |
Total Non Current Assets | 2,094,110 | 2,292,521 | 2,655,970 | 3,231,518 | 7,281,263 | 7,157,223 | 7,326,489 | 8,104,917 | 7,898,671 | 7,925,064 |
Other Assets | 0 | 0 | 0 | 1 | 1 | 2 | 0 | 1 | 1 | 0 |
Total Assets | 12,923,151 | 14,419,509 | 15,361,781 | 18,745,034 | 28,566,181 | 29,359,511 | 29,935,177 | 33,207,778 | 37,984,295 | 39,234,303 |
Account Payables | 460,793 | 538,852 | 591,737 | 751,695 | 1,325,398 | 1,069,179 | 1,037,338 | 1,321,247 | 1,616,128 | 1,631,401 |
Short Term Debt | 1,376 | 978 | 0 | 0 | 0 | 51,303 | 1,906 | 0 | 16,748.999 | 487,156 |
Tax Payables | 0 | 0 | 0 | 0 | 0 | 0 | 0 | 0 | 0 | 0 |
Deferred Revenue | 0 | 0 | 0 | 0 | 0 | 0 | 0 | 0 | 0 | 0 |
Other Current Liabilities | 193,569 | 1,054,153 | 192,803 | 222,319 | 389,809 | 294,138 | 341,765 | 377,021 | 418,017 | 2,481,403 |
Total Current Liabilities | 655,738 | 1,593,983 | 784,540 | 974,014 | 1,715,207 | 1,414,620 | 1,381,009 | 1,698,268 | 2,050,893.999 | 4,599,960 |
Long Term Debt | 5,278,343 | 5,796,858 | 5,198,312 | 7,035,084 | 8,558,356 | 7,776,638 | 5,955,758 | 4,652,338 | 4,047,294 | 2,453,443 |
Deferred Revenue Non Current | 0 | 0 | 0 | 0 | 0 | 0 | 0 | 0 | 0 | 0 |
Deferred Tax Liabilities Non Current | 0 | 0 | 0 | 0 | 0 | 0 | 0 | 0 | 0 | 0 |
Other Non Current Liabilities | 1,737,768 | 1,078,596 | 2,167,362 | 2,749,804 | 3,609,661 | 4,134,423 | 4,499,009 | 5,860,890 | 7,645,740.001 | 5,478,934 |
Total Non Current Liabilities | 7,016,111 | 6,875,454 | 7,365,674 | 9,784,888 | 12,168,017 | 11,911,061 | 10,454,767 | 10,513,228 | 11,693,034.001 | 7,932,377 |
Other Liabilities | 0 | 0 | 0 | 0 | 0 | 0 | 0 | 0 | 0 | 0 |
Capital Lease Obligations | 0 | 0 | 0 | 0 | 0 | 0 | 0 | 0 | 0 | 154,271 |
Total Liabilities | 7,671,849 | 8,469,437 | 8,150,214 | 10,758,902 | 13,883,224 | 13,325,681 | 11,835,776 | 12,211,496 | 13,743,928 | 12,532,337 |
Preferred Stock | 0 | 0 | 0 | 0 | 0 | 0 | 0 | 0 | 0 | 0 |
Common Stock | 20,722 | 21,364 | 23,707 | 24,312 | 33,442.999 | 33,656 | 33,838 | 33,994 | 29,268 | 29,508 |
Retained Earnings | 2,660,034 | 3,429,736 | 4,306,256 | 4,840,978 | 6,487,650 | 8,295,001 | 10,564,994 | 14,685,329 | 18,861,417 | 22,369,368 |
Accumulated Other Comprehensive Income Loss | 130 | 39 | -309 | 1,034 | -365.999 | 497.999 | -805 | -1,340.999 | 2,408 | 4,878.999 |
Other Total Stockholders Equity | 2,146,134 | 2,197,804.999 | 2,696,388 | 3,005,993 | 8,060,808 | 7,620,362.001 | 7,396,829 | 6,098,442.999 | 5,207,407 | 4,176,909.001 |
Total Stockholders Equity | 4,827,020 | 5,648,944 | 7,026,042 | 7,872,317 | 14,581,535 | 15,949,517 | 17,994,856 | 20,816,425 | 24,100,500 | 26,580,664 |
Total Equity | 5,251,302 | 5,950,072 | 7,211,567 | 7,986,132 | 14,682,957 | 16,033,830 | 18,099,401 | 20,996,282 | 24,240,367 | 26,701,966 |
Total Liabilities And Stockholders Equity | 12,958,267 | 14,419,509 | 15,361,781 | 18,745,034 | 28,566,181 | 29,359,511 | 29,935,177 | 33,207,778 | 37,984,295 | 39,234,303 |
Minority Interest | 424,282 | 301,128 | 185,525 | 113,815 | 101,422 | 84,313 | 104,545 | 179,857 | 139,867 | 121,302 |
Total Liabilities And Total Equity | 12,958,267 | 14,419,509 | 15,361,781 | 18,745,034 | 28,566,181 | 29,359,511 | 29,935,177 | 33,207,778 | 37,984,295 | 39,234,303 |
Total Investments | 955,981 | 1,242,921 | 1,447,283 | 1,753,390 | 1,835,408 | 2,076,235.999 | 2,187,189 | 3,020,636 | 4,298,046 | 4,357,355 |
Total Debt | 5,279,719 | 5,797,836 | 5,198,312 | 7,035,084 | 8,558,356 | 7,827,941 | 5,957,664 | 4,652,338 | 4,064,042.999 | 2,940,599 |
Net Debt | 4,087,915 | 4,746,168.001 | 3,992,747 | 4,501,622 | 7,188,383 | 6,616,058 | 3,210,797 | 1,897,615 | -575,299.001 | -3,374,407 |
Currency | USD | USD | USD | USD | USD | USD | USD | USD | USD | USD |
(* All numbers are in thousands)
Fiscal Year | 2014 | 2015 | 2016 | 2017 | 2018 | 2019 | 2020 | 2021 | 2022 | 2023 |
---|---|---|---|---|---|---|---|---|---|---|
Net Income | 628,693 | 819,200 | 913,091 | 771,754 | 1,717,513 | 1,842,119 | 2,467,553 | 4,456,549 | 4,648,501 | 3,961,291 |
Depreciation And Amortization | 38,542 | 43,666 | 50,219 | 66,324 | 91,181 | 92,200 | 94,553 | 85,954 | 87,075 | 110,164 |
Deferred Income Tax | 75,324 | -5,637 | 97,485 | 91,050 | 268,037 | 235,493 | 92,082 | 191,627 | -246,653 | -67,968 |
Stock Based Compensation | 40,718 | 43,873 | 55,516 | 61,356 | 72,655 | 86,940 | 107,131 | 134,621 | 184,086 | 160,720 |
Change In Working Capital | -1,582,612 | -1,313,566 | -685,063 | -187,359 | -169,254 | -827,066 | 1,319,104 | -1,650,902 | -2,321,356 | 571,536 |
Accounts Receivables | -522,354 | -433,325 | -212,684 | 102,976 | -462,312 | -119,084 | 180,720 | -289,776 | -422,398 | -329,191 |
Inventory | -1,367,415 | -1,126,907 | -503,527 | -661,494 | -135,870 | -623,644 | 781,362 | -1,960,614 | -2,383,821 | 2,274,083 |
Accounts Payables | 326,087 | 225,790 | 21,432 | 356,669 | 412,796 | -14,639 | 266,488 | 881,309 | 701,113 | -625,862 |
Other Working Capital | -18,930 | 20,876 | 9,716 | 14,490 | 16,132 | -69,699 | 90,534 | -281,821 | -216,250 | -747,494 |
Other Non Cash Items | 10,847 | -7,182 | 76,556 | 193,739 | -268,523 | 52,657 | 110,396 | -685,075 | 914,015 | 443,995 |
Net Cash Provided By Operating Activities | -788,488 | -419,646 | 507,804 | 996,864 | 1,711,609 | 1,482,343 | 4,190,819 | 2,532,774 | 3,265,668 | 5,179,738 |
Investments In Property Plant And Equipment | -22,599 | -91,355 | -76,439 | -111,773 | -130,439 | -86,497 | -72,752 | -65,172 | -57,214 | -99,799 |
Acquisitions Net | -165,272 | -314,937 | -426,486 | -1,041,407 | -1,283,555 | -394,089 | -471,239 | -375,843 | -447,401 | -201,042 |
Purchases Of Investments | -70,606 | -105,753 | -80,200 | -160,820 | -78,373 | -36,261 | -45,548 | -128,162 | -93,769 | -8,000 |
Sales Maturities Of Investments | 101,117 | 30,640 | 25,467 | 45,375 | 439,459 | 52,593 | 56,166 | 30,946 | 26,083 | 4,673 |
Other Investing Activites | 595,719 | 383,012 | 471,821 | 398,808 | 444,786 | 483,850 | 253,168 | 433,145 | 443,999 | 127,187 |
Net Cash Used For Investing Activites | 438,359 | -98,393 | -85,837 | -869,817 | -608,122 | 19,596 | -280,205 | -105,086 | -128,302 | -176,981 |
Debt Repayment | -625,592 | -817,031 | -90,370 | -1,422,968 | -2,052,191 | -1,122,902 | -2,294,141 | -1,355,063 | -623,079 | -1,226,251 |
Common Stock Issued | 13,599 | 9,405 | 19,471 | 720 | 3,061 | 493 | 0 | 276,080 | 0 | 28,712 |
Common Stock Repurchased | -20,424 | -23,188 | -19,902 | -27,054 | -299,833 | -523,074 | -321,524 | -1,430,212 | -1,039,309 | -1,182,711 |
Dividends Paid | -32,775 | -33,192 | -35,324 | -37,608 | -49,159 | -51,454 | -195,043 | -309,776 | -438,038 | -430,560 |
Other Financing Activites | 1,326,630 | 1,258,676 | -105,287 | 2,681,206 | 202,221 | 67,713 | 364,133 | 414,236 | 823,147 | -436,779 |
Net Cash Used Provided By Financing Activities | 661,438 | 394,670 | -250,883 | 1,194,296 | -2,195,901 | -1,629,224 | -2,446,575 | -2,404,735 | -1,277,279 | -3,247,589 |
Effect Of Forex Changes On Cash | 0 | 0 | 0 | 0 | 0 | 0 | 0 | 0 | 0 | -1,660,917 |
Net Change In Cash | 311,309 | -123,369 | 171,084 | 1,321,343 | -1,092,414 | -127,285 | 1,464,039 | 22,953 | 1,860,087 | 1,755,168 |
Cash At End Of Period | 1,281,814 | 1,158,445 | 1,329,529 | 2,650,872 | 1,558,458 | 1,468,691 | 2,932,730 | 2,955,683 | 4,815,770 | 6,570,938 |
Cash At Beginning Of Period | 970,505 | 1,281,814 | 1,158,445 | 1,329,529 | 2,650,872 | 1,595,976 | 1,468,691 | 2,932,730 | 2,955,683 | 4,815,770 |
Operating Cash Flow | -788,488 | -419,646 | 507,804 | 996,864 | 1,711,609 | 1,482,343 | 4,190,819 | 2,532,774 | 3,265,668 | 5,179,738 |
Capital Expenditure | -22,599 | -91,355 | -76,439 | -111,773 | -130,439 | -86,497 | -72,752 | -65,172 | -57,214 | -99,799 |
Free Cash Flow | -811,087 | -511,001 | 431,365 | 885,091 | 1,581,170 | 1,395,846 | 4,118,067 | 2,467,602 | 3,208,454 | 5,079,939 |
Currency | USD | USD | USD | USD | USD | USD | USD | USD | USD | USD |
(* All numbers are in thousands)
Revenue (TTM) : | P/S (TTM) : | 1.24 | ||
Net Income (TTM) : | P/E (TTM) : | 10.83 | ||
Enterprise Value (TTM) : | 43.494B | EV/FCF (TTM) : | 11.14 | |
Dividend Yield (TTM) : | 0.01 | Payout Ratio (TTM) : | 0.12 | |
ROE (TTM) : | 0.16 | ROIC (TTM) : | 0.13 | |
SG&A/Revenue (TTM) : | 0.02 | R&D/Revenue (TTM) : | 0 | |
Net Debt (TTM) : | Debt/Equity (TTM) | 0.1 | P/B (TTM) : | 1.66 | Current Ratio (TTM) : | 11.5 |
Trading Metrics:
Open: | 159.55 | Previous Close: | 159.33 | |
Day Low: | 158.85 | Day High: | 159.55 | |
Year Low: | 113.7 | Year High: | 177 | |
Price Avg 50: | 166.34 | Price Avg 200: | 153.43 | |
Volume: | 24634 | Average Volume: | 39750 |