Exchange: | NYSE |
Market Cap: | 43.077B |
Shares Outstanding: | 723.486M |
Sector: | Consumer Defensive | |||||
Industry: | Grocery Stores | |||||
CEO: | Mr. William Rodney McMullen | |||||
Full Time Employees: | 414000 | |||||
Address: |
|
|||||
Website: | https://www.thekrogerco.com |
Click to read more…
Operator: Good morning, and welcome to The Kroger Co. Second Quarter 2024 Earnings Conference Call. [Operator Instructions] Please note this event is being recorded. I'd now like to turn the conference over to Rob Quast, Senior Director, Investor Relations. Please go ahead.
Rob Quast: Good morning. Thank you for joining us for Kroger's Second Quarter 2024 Earnings Call. I am joined today by Kroger's Chairman and Chief Executive Officer, Rodney McMullen; and Interim Chief Financial Officer, Todd Foley. Before we begin, I want to remind you that today's discussions will include forward-looking statements. We want to caution you that such statements are predictions and actual events or results can differ materially. A detailed discussion of the many factors that we believe may have a material effect on our business on an ongoing basis is contained in our SEC filings. The Kroger Company assumes no obligation to update that information. After our prepared remarks, we look forward to taking your questions. In order to cover a broad range of topics from as many of you as we can, we ask that you please limit yourself to one question and one follow-up question if necessary. I will now turn the call over to Rodney.
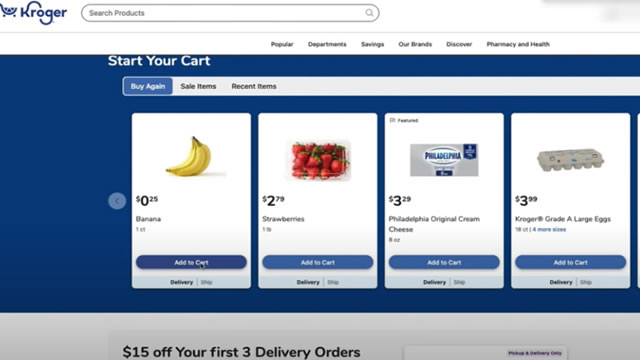
Rodney McMullen: Thank you, Rob. Good morning, everyone, and thank you for joining us today. Before we begin, I'd like to provide an outline of our discussion topics this morning. I will start by sharing a recap of our second quarter performance and highlight how we continue to advance our go-to-market strategy, which powers our value creation model and drives long term sustainable growth for our shareholders. Then Todd will cover our financial results for the second quarter, and finally, I will close with an update on our pending merger with Albertsons. Turning to our performance this quarter, we continue to execute our strategy and we are delivering solid financial results through the strength and diversity of our model. We are driving positive customer activity with a compelling combination of affordable prices and personalized promotions on great quality products, all through a unique seamless experience. Our strong customer trends also reflect our enhanced focus on elevating the customer experience through excellent store execution, which continued into the second quarter. Customers continue adjusting to the current economic environment. The reduction of excess savings built up during the pandemic, higher interest rates and the effect of inflation are pressuring customers' ability to spend. This is especially true for our most budget-conscious customers, as we've been seeing for a while now, but we're now seeing other customer segments beginning to make changes as well. Customers are purchasing lower-priced cuts of meat, buying less and focusing on essentials. Budget-conscious customers are buying more at the beginning of the month to stock up on essential items and groceries. And then as the month progresses, they are more cautious with their spending. In response, we are supporting our customers by keeping prices low through promotions, including loyalty discounts, personalized offers and fuel rewards. We are also expanding our multi-tiered portfolio of Our Brands products, which provides customers exceptional alternatives to national brands competing on quality, while at a noticeable lower price point. Our long term model demonstrates that by consistently keeping prices low, we increase customer loyalty and grow share of wallet. While the food-at-home industry remains competitive, our model drives efficiencies that allow us to sustainably invest in value and maintain competitive price spreads with key competitors. In addition to lowering prices, we executed our go-to-market strategy through our pillars of Fresh, Our Brands, personalization and seamless. We are proud of our associates for bringing this strategy to life with another quarter of excellent store execution. This led to another quarter of strong customer trends, including total and loyal household growth and an increase in customer visits. Mainstream households, our largest customer segment, led our sales growth through more households and increased visits. By delivering a more consistent customer experience, we are moving customers up the loyalty ladder and positioning ourselves for long term sales growth. I'd now like to cover how we are enhancing our go-to-market strategy, starting by leading with Fresh. Our Fresh for Everyone promise reflects our commitment that customers can trust the quality and freshness of every item they purchase. This promise is only possible through our strong relationships with farmers and suppliers, which enables Kroger to source the freshest products. Field & Vine, one of the newest Our Brands lines, offers regionally grown berries picked at peak freshness. We are very pleased with the initial customer response to this line. Our Brands is an important differentiator for our business, enabling us to offer innovative products at a great value. This combination of quality and value led to Our Brands sales growth outpacing national brand sales growth this quarter. More than 90% of our customer households purchased Our Brands products during that time. Across the portfolio of Our Brands, we are expanding into new categories and launching new products with almost 600 already introduced this year. Each of these new products is thoroughly tested and validated to earn its spot on our shelves, competing aggressively with national brands with no compromise on quality. Smart Way, one of our opening price point brands, is delivering exceptional value to customers on a budget. These are ultra low-priced essentials and pantry staples that we know our customers need the most. We continued expanding the Smart Way lineup in the second quarter to meet our customer needs for more value. We are also making progress on Our Brands refreshment roll out, with more of Our Brands portfolio to be refreshed later this year. We are excited to see our customers respond to these new designs. As we innovate within the portfolio and expand to meet customer needs, we are improving our mix and driving better profitability. For example, our manufacturing plants allow us to make many of our own products, keeping costs lower as we pass those savings on to customers while preserving our ability to grow margins. Next is an update on personalization. Our loyalty program and personalized promotions enabled us to deliver value beyond the shelf price. We collect data and insights, which enable us to enhance our personalization capabilities, delivering better product recommendations and more effective promotions. As a result, we are generating greater unit lift on promotions compared to the industry. Boost, our paid membership program supports our personalization capabilities. This quarter, we held a Boost Bonus Days event, which provided Boost customers even more savings during the two week special event. This event went well above and beyond the incredible value the membership already offers with daily savings, free delivery on orders of $35 or more and two times fuel points. Now turning to seamless. Digital sales grew 11%, driven by an increase in both households and traffic. One of the many ways we move customers up the loyalty ladder is to convert digitally-engaged households into e-commerce households. This means we are moving customers from simply using our app or website to making purchases through one of these digital channels. This work resulted in our teams growing e-commerce households 14% this quarter. Households who shop with us digitally and in our stores are important because they are our most loyal and increase retail media and monetization opportunities. Delivery solutions led our sales growth once again this quarter, with pickup also showing very strong demand. Demand across our Kroger delivery network, which provides customers a premium shopping experience, continues to grow. Customers tell us they love the convenience of on-time and refrigerated delivery right to their homes. Profitability remains a key focus as we drive volume growth through our Customer Fulfillment Centers. Our teams are working hard to improve the shape of weekly and daily demand as well as refining trade areas to improve customer delivery density. By executing our go-to-market strategy, we are building loyalty and creating more growth opportunities. First, with alternative profit businesses, which had a strong quarter, led by growth in Kroger Precision Marketing, their results were in line with internal expectations and keep us on track to deliver more than 20% media growth this year. Next is health and wellness, we continue to be optimistic about this area of our business. We know that grocery customers, who are also pharmacy customers, are more loyal to Kroger, and spend more with us. While the pharmacy industry is going through a period of transformation and disruption, we have a unique opportunity to help our customers live healthier lives and grow share. Over the long term, we remain confident and our teams are working hard to navigate industry challenges and position the company for future growth. During the quarter, sales outpaced internal expectations. Profitability was similar to last year, but behind internal expectations due to product mix pressures, specifically as a result of strong GLP-1 sales. We expect GLP-1s to have a similar impact on our results for the remainder of the year. Our vaccine efforts are ramping up now and should help offset some of the GLP-1 impact in the second half of the year. Turning to associates, our full fresh and friendly commitment is our roadmap to achieving a best-in-class customer experience, and we appreciate our associates for delivering again this quarter. We are facilitating this improved customer experience through our commitment to be an employer of choice. We are achieving this by investing in associate wages and by continuing to create an outstanding supportive work environment. It is great to see these efforts recognized with a perfect score on the 2024 Disability Inclusion Equality Index, making Kroger a Best Place to Work for Disability Inclusion for the fifth consecutive year. With that, I'll now turn it over to Todd to take you through our second quarter financial results. Todd?
Todd Foley: Thanks, Rodney, and good morning, everyone. Kroger's second quarter results reflect the resilience of our model as investments made to diversify our business are enabling us to navigate an environment of economic uncertainty. Our results through the first half of the year are in line with our expectations, and with our improving sales momentum, we are able to reaffirm our full year guidance. I'll now take you through our second quarter financial results. We achieved identical sales without fuel growth of 1.2%. As Rodney mentioned earlier, identical sales were supported by several positive customer metric trends, including increases in total and loyal households and increased customer visits. We are encouraged by favorable unit trends as we continue to make progress toward achieving positive unit growth. As we saw in the first quarter, vendor support for promotions has been strong, and we will continue to deliver on our long term commitment of providing customers with exceptional value. Digital sales had a strong quarter, led by 17% growth in delivery solutions. Pickup is an important part of our seamless ecosystem and demand continues to be strong, with pickup sales growing 10%. This reflects our digital team's relentless focus on delivering a great customer experience, resulting in increased fill rates, a reduction in wait times and a 33% improvement in perfect orders, which are orders with both a 100% fill rate and that are completed within an appropriate wait time. With the help of AI-enabled advancements and dynamic batching and routing, we are able to offer two hour lead times and pickup in all stores. These improvements in customer experience are being accompanied by productivity enhancements, resulting in an improvement in our cost to serve. Turning to margins, I would like to spend a little more time today talking about our second quarter trends in gross margin and OG&A rates. As you know, our long term model is designed to deliver consistent year-over-year gross margin rate and OG&A rates in a way that we deliver slightly expanding operating margins over time. Though there can be puts and takes in these measures from quarter-to-quarter, over the long term, our business model gives us the flexibility to balance investments in lower prices and higher associate wages with growth in margins through Our Brands and alternative profit businesses as well as cost-saving initiatives and productivity, all to ensure that we are consistently returning value to shareholders. This expectation is true for fiscal 2024 as well. For the full year, we now expect FIFO gross margin rate, excluding fuel, to be slightly positive, balanced by the OG&A rate without fuel, which will be slightly negative. This quarter, FIFO gross margin rate, excluding fuel, was 42 basis points favorable to last year and was slightly ahead of our expectations for the quarter. Conversely, the OG&A rate, excluding fuel and adjustment items, was 65 basis points unfavorable to last year as well as unfavorable to our expectations, primarily due to several nonrecurring charges during the quarter. Looking in more detail at our quarterly results, gross margin was 22.6% of sales. The increase in FIFO gross margin rate, excluding fuel, was primarily attributable to favorable product mix in our grocery business, including Our Brands, lower shrink and sourcing benefits, partially offset by lower pharmacy margins. The result reflected Kroger's ability to improve margin while being competitive on price and helping customers manage their budgets. The improvement in shrink reflects the significant ongoing work from our operations team as they address this challenging issue. While we are pleased with the result this quarter, shrink related to theft remains high on a historical basis, and we still have work to do to further mitigate the financial impact. The increase in OG&A rate, excluding fuel and adjustment items, was driven by investments in associate wages, increased incentive plan costs and nonrecurring costs, including hurricane expenses and an increase in costs due to the severity of general liability claims, partially offset by continued execution of cost savings initiatives. During the second quarter, we recorded a LIFO charge of $21 million, compared to a charge of $4 million for the same quarter last year. Adjusted FIFO operating profit was $984 million. Our adjusted EPS was $0.93 per diluted share, a decline of 3% compared to last year. Fuel is an important part of our total value proposition. It builds loyalty through our Kroger Plus program by offering customers another way to save and led to gallon sales outpacing the industry this quarter. Fuel profitability was stronger in the second quarter compared to last year on a cents per gallon basis. In the second half, we will be cycling stronger fuel results, but expect margins to be relatively flat compared to last year. I wanted to provide a brief update on inflation, a topic I am asked about frequently. Inflation increased slightly in the second quarter from the first quarter, but is trending around 1%, which is consistent with our expectations since the start of the year. I'd now like to provide a brief update on associates and labor relations. During the second quarter, we ratified new labor agreements for our Food 4 Less warehouse stores in Southern California, Columbus Valley stores, Mid-Atlantic Division stores, Anderson Bakery, Michigan, West Michigan and New Market clerks, Central Peoria clerks and Shelbyville warehouse, covering more than 13,000 associates. Kroger is working to reach an agreement with the UFCW for meat and grocery associates at 29 Fred Meyer stores in Portland. We respect our associates' right to collectively bargain. Associates at these stores chose to strike for six days before returning to work last week. Negotiations continue this week, and we remain open to constructive dialogue with the UFCW. We are also communicating to local unions. They are coming to the table with proposals that do not balance investing in associates, with keeping groceries affordable for our customers and supporting a growing and profitable business model are untenable. It underlines our goal of growing the company in a way that helps to ensure job security and create more jobs and advancement opportunities for more associates. Turning to cash flow, Kroger continues to generate strong adjusted free cash flow through consistent operating results. Consistent generation of free cash flow is an important part of our model and is enabling us to deleverage in anticipation of our merger with Albertsons. At the end of the second quarter, Kroger's net total debt-to-adjusted EBITDA ratio was 1.24, compared to our target range of 2.3 to 2.5. Our strengthened balance sheet provides us flexibility to pursue growth and enhance shareholder value. We continue to take a disciplined approach to deploying capital, prioritizing the highest growth opportunities that strengthen our business and deliver solid returns for shareholders. We're committed to maintaining our investment-grade debt rating, increasing our dividend over time, subject to Board approval and returning excess capital to shareholders when we are able to do so. The strength of our free cash flow gives us the ability to invest in the growth of our business. We are allocating more capital to our major and minor store projects this year. Our teams have done an excellent job completing projects ahead of schedule. And year-to-date, we have completed almost double the amount of store projects as we had completed last year at this time, which will position us to grow in the second half of 2024 and 2025. It also creates capacity later this year to work towards opening 2025 projects earlier in the year as well. To reflect this, we are raising our guidance for full year capital expenditures from a range of $3.4 billion to $3.6 billion to a range of $3.6 billion to $3.8 billion. Based on the strength of our free cash flow, the change to our CapEx guidance does not affect our adjusted free cash flow guidance. In the second quarter, we raised our quarterly dividend by 10%, reflecting confidence in our ability to generate strong cash flow. Our quarterly dividend has grown at a 13.5% compounded annual growth rate since being reinstated in 2006, and this marked the 18th consecutive year of dividend increases. I'd now like to provide some additional color on our outlook for the rest of the year. We are encouraged by our performance through the first half of the year, which led to results that were in line with expectations. Our solid sales results through the first two quarters of the year give us confidence to raise the low end of our full year identical sales without fuel guidance. We now expect identical sales without fuel to be in the range of 0.75% to 1.75%. We are cautiously optimistic about our sales outlook for the second half of the year and expect customers to continue prioritizing food and essentials. We have developed merchandising plans that are designed to enhance customer engagement, drive spending and improve unit volumes. The strength of our model enables us to navigate an environment where customer spending is constrained by current economic pressures, and we expect the various components of our model, including grocery, health and wellness, fuel and alternative profit businesses to provide us with flexibility in how we create shareholder value. As a result, we are reaffirming the rest of our full year guidance. I'll now turn the call back to Rodney.
Rodney McMullen: Thanks, Todd. Before I open it up for Q&A, I'd like to speak briefly about our pending merger with Albertsons. First, I would like to express my appreciation for our associates and their incredible commitment. It has been a long journey, and our associates have done an excellent job serving customers and running the day-to-day operations of our business, while also preparing for the merger. Integration work continues to progress, and our teams are laser-focused on ensuring a seamless transition for our customers and associates from day one. It is exciting to see the complementary strengths of both Kroger and Albertsons organizations, and we look forward to combining these strengths to provide customers an even better experience. As part of our merger preparation, Kroger recently launched an exchange offering for Albertsons notes, contingent upon the closing of the merger as well as a successful new offering for $10.5 billion of senior unsecured notes with the net proceeds expected to fund a portion of the cash consideration for the proposed merger. A portion of the proceeds of this offering is subject to a special mandatory redemption if the merger does not close. As the preliminary injunction trial with the FTC nears its conclusion, we are confident in the facts and the strengths of our position. The retail industry continues to be more competitive, and we know how our customers shop. Every day, they are making decisions on where to eat and where to buy their groceries. They shop at a wide range of competitors from Costco to Amazon to Dollar Stores, and they eat at restaurants. They shop digitally and brick-and-mortar. As I have said before, we remain committed to closing the merger because it will provide meaningful and measurable benefits for customers, associates and communities across the country, and we look forward to bringing these commitments to life. Regardless of the outcome of the trials, Kroger is operating from a position of strength and we are optimistic about our future. Our business is more diverse than ever, and our value creation model provides us with multiple ways to drive sustainable growth. We are delivering strong free cash flow that allows us to invest in our business and drive attractive returns for our shareholders. With that, Todd and I look forward to taking your questions. Because we are in litigation, we will not be taking questions on the merger this morning.
Operator: Thank you. [Operator Instructions] Our first question for today comes from Ed Kelly of Wells Fargo. Your line is now open. Please go ahead.
Edward Kelly: Hi, good morning, everyone.
Rodney McMullen: Good morning.
Edward Kelly: There's been increased concern around the competitive backdrop, rising promotions across the industry. Can you just talk about what you are seeing from a promotional and competitive standpoint? And then what are your plans as you think about the back half of the year? I mean you did raise the gross margin guidance a bit today. So it certainly seems like you believe you can manage it. But just thoughts around what's going on out there and your promotional plans.
Rodney McMullen: Yeah, if you look, I would say the promotions are getting back to pretty much normal. And obviously, during COVID there was less promotions because supply chains were under tremendous pressure. The other thing that we would say on the promotions we are doing, we view -- the ones that we're doing are more effective and the CPG partners are increasing their support for some of those as well as they're trying to grow tonnage. If you look at -- as Todd outlined, overall, we feel good about the balance of the year and balancing cost reductions and mix changes that are helping gross and our continued investment in pricing, which we've been doing for, I think, close to 20 years now.
Operator: Thank you. Our next question comes from Kelly Bania from BMO. Your line is now open. Please go ahead.
Kelly Bania: Hi, good morning. Thanks for taking our questions. Just wanted to dive in a little bit more on gross margin. It was really quite strong, and you called out some of the factors there. But can you help us just understand how digital is impacting gross margin? Is that included in your kind of mix category? And just a general update on digital profitability as you look forward really into the back half and the next couple of years here?
Todd Foley: Yes. Be glad to, Kelly. Yes, you're right. As we went into the year, we talked about the expectations for our margins to be relatively flat. And included in that expectation was a little bit of an increase in the second quarter year-over-year. But even on top of that, some of the strength that we saw in Our Brands, like we called out, we had a tremendous quarter in Our Brands, actually, the sales growth there outpaced national brands quite meaningfully that helped drive it above our expectations. And also, we had a great shrink quarter. It's been a while since we've looked year-over-year on shrink and seen positive results. So that's really exciting to see as we called out. Still a lot of work to do there on a go-forward basis. So it was a little bit better than our expectations, which were to be up some, and therefore, for the balance of the year, we do expect for the full year margins to now be slightly favorable on a year-over-year basis. So from a digital profitability standpoint, Rodney, if you want to add anything in that space?
Rodney McMullen: Yes, I'll just a couple of comments. We continue to make progress. If you look at over the next two or three years, we see the opportunity to make significant progress, and we would hold ourselves accountable for doing that. The thing that's pretty special about the overall ecosystem that we're building, is when you look at a customer that engages with us seamless, they actually still physically go into stores. Sometimes they do delivery, sometimes they do pick up. They also become more loyal in other aspects, becoming Boost members, engaging in pharmacy. So as you look out over the next two or three years, we are very excited about the potential of that and the continued progress. Obviously, the media business helps gross margin and the margins in that is significantly different than anything that we've ever sold in the supermarket store. Thanks Kelly.
Operator: Thank you. Our next question comes from John Heinbockel of Guggenheim Partners. Your line is now open. Please go ahead.
Anders Myhre: Good morning. This is Anders Myhre on for John. Between the proactive cost reductions, the media growth and the moderating digital losses, should we expect a greater amount of P&L benefits than there have been in recent years? And if so, how much of this incremental benefit flows through to the bottom line versus reinvestment into other areas of the business? Thank you.
Todd Foley: Yeah. Great question. The things that you call out are great examples of some of the margin enhancement programs that we've talked about in the past as well as some of the productivity improvements and cost improvements that we've realized over time. That's an important part of our overall business model, being able to use that value that we create through the things that you called out to invest it back in the business. Rodney alluded to it. We have a long history of taking that value and reinvesting it back in the business in a way that over time, our operating profit rate grows slightly over time. So as we grow the top line, as we're able to balance the investments with the benefits that we get from those that drives the bottom line over time.
Rodney McMullen: Yes, I think it's always a good reminder that our long term TSR model is 8% to 11% a year. That long term TSR model assumes that we continue to move and grow alternative profit businesses, continue to invest in wages, continue to invest in lower prices for our customers. As you know fortunately, we generate a tremendous amount of free cash flow. We would expect over time for more of that growth to come from the business as opposed to buying back stock. And then once the merger happens, obviously, there's incremental accretion that will happen because of the merger for a period of time that once the merger happens, we'll give more insights into. Thank you.
Operator: Thank you. Our next question comes from Leah Jordan of Goldman Sachs. Your line is now open. Please go ahead.
Leah Jordan: Good morning. Thank your for taking my question. Thinking if you could comment on your market share trends in the quarter, and especially interested in any color on what you're seeing in Fresh specifically as I know that's been a big area of investment for you?
Rodney McMullen: Yes. If you look at our Fresh trends overall, they would be stronger than the center store. Overall, I would say that we feel okay about where we are. But if you look, going forward, we continue to see improvement, and we would expect to see improvement throughout the balance of the year. So it's one of those areas where we're not satisfied. We are gaining strong household growth and strong loyal household growth as well, which also, in the past, always leads to future progress as well. So I would say that we feel okay where we are. We're more excited about what we see where the trends are and where we see for the balance of the year and next year because we're also incrementally adding storing [ph] as well, which helps on market share as well. Thanks Leah.
Operator: Thank you. Our next question comes from Simeon Gutman of Morgan Stanley. Your line is now open. Please go ahead.
Simeon Gutman: Good morning, everyone. Two-parter. First, if you look at the second quarter and the second half, the difference in comp that you're guiding to, how is it changing between units and inflation? I heard the inflation piece, but curious how the guidance reflects this. It looks like it's slightly better than consensus. The second part is, if this environment stays, and I know you're not -- you're trying to improve share and grow comps. But if we stay in this very low single-digit environment, do you spend the same way in the business next year, and you think you can keep the core EBIT dollars roughly flat or margin flat in this backdrop? Thank you.
Todd Foley: Yes. Good question, Simeon. Let me start with the differences in comp. We did update our sales guidance for the year, taking up the bottom end of that range, as you saw from 25 basis points to 75 basis points, but kept the top end of the range at 1.75 basis points. And I think our thought process around that was really to take the low end off the table. If you think about where we came into the year, and there was quite a bit of disinflation last year. That was still kind of hitting us early in the year and wanted to make sure that we were navigating through that uncertainty. Our view at the time was that Q1 would be the low point of the year, and we would consistently grow our sales as we went through the year on a backdrop of inflation that was 1%-ish as we go throughout the year. And that's really -- certainly through the first half, it's played out as we expected in the first half of the year. And our expectations for the back half are very similar to the way that we thought about it back then. So I would say both our expectations on the sales and the inflation environment backdrop against which, it hasn't really changed a whole lot, and we expect that growth to flow. From a unit standpoint, we've talked about that a little bit. Rodney alluded to the fact we continue to be encouraged by the trends there. We're still a little negative on the unit side, but we continue to be encouraged by the progress that we're making in that space and think that will be part of the contribution to the sales trend that we see for the back half of the year.
Rodney McMullen: Yeah, we are seeing progress on units. We would expect to continue to see progress on units. You didn't really ask, but if -- the thing that's right now, what we're seeing is, and I mentioned it earlier, in the first of the month, our business is really strong, holidays are strong. And then when you get to the end of the month, they're weaker because of the people being constrained on a budget. So far in the third quarter, we're tracking a little bit better than where we were in the second quarter. So fundamentally, we believe all the programs we're doing is making improved connection. Your question relative to 2025, I would say it's still early for us to start sharing guidance on 2025, and I would just -- the comments I made earlier about our long term business model really would apply to 2025. Obviously, we would expect to be in a position of where we've just completed a merger, and we would also need to update where we are relative to the merger and the integration of the merger and those factors as well. So thanks, Simeon, for the question.
Operator: Thank you. Our next question comes from Michael Montani of Evercore ISI. Your line is now open. Please go ahead.
Michael Montani: Great. Thank you for taking the question. It seems that the guide is implying a stable or even slightly up EBIT margin in the back half of the year. And I just wanted to understand a little bit if you could parse out the drivers behind that, in particular, with relation to shrink, if there's favorable compares coming up that give you confidence, and/or if there's certain onetime costs that you could quantify for us on OG&A that wouldn't come up again?
Todd Foley: Yeah. We'll do, Michael. You're right. Great call out. And as we look at the back half of the year, we talked about, given the trends that we saw in the second quarter, our view for the year on gross margin would be that it will be slightly favorable year-over-year. And on OG&A, the annual trend will be slightly unfavorable year-over-year. But we do expect those to reasonably balance as they come out. We talked a little bit about shrink earlier. And again, we're really excited about the results that we saw in shrink, but I mentioned the caution that we have there. There is a lot of work to do. That issue is still out there. And our shrink costs are high relative to history on where we've been this. So our team continues to work in that space and continues to drive it. You can't have a trend until you have a data point. And so we're excited to see where we're at, but we're kind of cautiously optimistic about the opportunities for shrink for the balance of the year. Relative to some of the other costs--
Rodney McMullen: Before you move on, one additional shrink, Michael, that you might -- that everyone might find helpful is if you look at our Fresh side of our business, we've made meaningful progress on improving shrink over several quarters. Now when you look at the center store with organized retail crime and other things, you couldn't see it. But there's been tremendous changes by using technology, AI processes, and our teams have done a nice job of improving the Fresh side on shrink. That's not subject to as much theft, but it's really process-oriented. So now, Todd, I'll let you go and talk about some of the other stuff.
Todd Foley: Yes. Great color, I appreciate that. Talking a little bit on the cost side, there are -- we did see in the second quarter in part of why it was a little bit worse than our expectations, some non-recurring type of items. The main one was some costs related to Hurricane Beryl that came through. Obviously, that was event-driven relative to that. The second, and we've talked a little bit about this, we've talked about incentive being a little bit higher than our expectations. We do think for the second half of the year that will have less of an impact on our year-over-year OG&A than what we've seen in the past as well. So I think those are a couple of the examples of things that we don't expect to continue in the second half.
Rodney McMullen: Thanks Michael.
Operator: Thank you. Our next question comes from Kenneth Goldman of JPMorgan. Your line is now open. Please go ahead.
Kenneth Goldman: Hi, thank you and good morning. I wanted to dig in a little bit deeper into inflation, just in light of the CPI and PPI numbers that came out this morning. Usually the two rates have changed. They're not perfectly correlated, but they're somewhat correlated. And right now, PPI food is increasing at a faster clip than CPI. So I just wanted to get a sense for how you think about balancing the need to pass on inflation? I know that PPI is not a perfect proxy for that, but it's somewhat of a proxy. Balance that with the desire to continue to appeal to budget-conscious consumers, and then how do we reconcile all of that with the fact that your GM growth was so good when PPI is growing so much faster than CPI?
Rodney McMullen: Yes. As you've mentioned, I mean, you're always trying to balance all the pieces. Part of the PPI is it's -- certain parts of it are commodity-driven. And we will -- if we think something is a permanent cost increase then we try to pass that along as fast as we can. If it's a short-term blip, then we'll manage that based on what's going on in the market. And it's as difficult now estimating where inflation is going to be as probably any period of time, but we are seeing it being reasonably stable. If you look out in terms of price increases that CPGs have already shared with us because obviously, we'll see that in advance of it happening, it would certainly still be in the range of where we said we think overall inflation will be around 1%. And we don't see anything that's causing us to see that be much different than that. Over time, we do find the two kind of line up pretty close. The other thing that we are seeing is inflation on food away from home is meaningfully higher than food at home. And we are beginning to see customers move back from restaurants to food at home because you can prepare a meal at home for about a fourth of the cost of going out and getting a meal. So that is something that we are beginning to see a little bit of as well. I don't know, Todd, anything else you want to add on inflation?
Todd Foley: I don't. Thanks, Rodney.
Operator: Thank you. Our next question comes from Rupesh Parikh from Oppenheimer. Your line is now open. Please go ahead.
Rupesh Parikh: Good morning.
Rodney McMullen: Good morning.
Rupesh Parikh: Good morning. Thanks for taking my questions. So first on CapEx, so higher range for this year. So I just want to get a sense of if we should think about this level of spend as more of a normal going forward. And then secondly, not sure if you're giving any clarity in terms of how to think about the EPS growth cadence between Q3 and Q4 as I know you're lapping the 53rd week later this year.
Todd Foley: Yes. Great color, Rupesh. On the CapEx, yes I think we talked about it. We've been working really hard to take the opportunity to get these storing projects open as quickly as we can to be able to serve customers. And so shifting spend from late in '24 to early in '24. You saw our CapEx year-to-date be a little bit higher. That's going to create some capacity to help us pull early -- what might have been early '25 construction process into late '24, so we can open next year's projects early too. So I think given the strong cash flow in the business, if we're able to continue to execute that, then I think what we'll see should be a lift in our spend in our capital plan over time.
Rodney McMullen: And we're -- the money that we're investing, we're seeing good performance to budget as well. And operationally, it's a lot easier to open up a remodel or new store expansion earlier in the year versus later in the year as well.
Todd Foley: And then talking to your EPS comment, Rupesh, yes, for the balance of -- given where we landed in the first quarter in our actual results -- for the first half of the year, sorry, our first half kind of landed where we expected it to, quarter's played out a little bit differently than we thought. But the first half landed where we expected. And reaffirming the rest of the year, the back half, we think is right on par with where we've been guiding as well. Within that, we do think that the third quarter will be probably slightly ahead of where we were year-over-year and the fourth quarter probably slightly behind on a 52-week basis when you compare it 52 to 52, but that's probably how the trend will play out for the balance of the year.
Operator: Thank you. Our next question comes from Michael Lasser of UBS. Your line is now open. Please go ahead.
Mark Carden: Good morning. It's Mark Carden on for Michael Lasser this morning. Thanks so much for taking the question. So you talked about some of the trade down that's accelerated in 2Q to additional income cohorts, and also highlight some of the pressures that budget customers are facing. What kinds of behavior changes are you seeing in your middle income and above cohorts? And when did you see this become more pronounced?
Rodney McMullen: Yes. It's throughout the year, and as I mentioned before, we're seeing it more at the end of the month than the beginning of the month. And people continue to be aggressive or whatever the right term is on celebrating holidays. Now I think one of the things that's always important to remember is those changes aren't -- many of those changes are beneficial to us. So if you think about people moving from eating at a restaurant to cooking at home, that's beneficial for us. If we look at customers' changing segments, that's good for us because they typically will buy more Our Brands, products and they'll buy smaller packages and some of those things as well. So when we look, it's been really throughout. But I would say, over the last few months, it's been more pronounced as you get toward the end of the month. But all of those things are things that -- obviously, you're changing your promotional approach, your connection with the customers, what offers you make at different times of the month and all those things. So overall, the customer, as we've said all along, are under tremendous strain, especially customers on a budget. That was the reason why I want to say it was probably 1.5 years ago or 2 years ago, we saw that coming, and we introduced our Smart Way product to be much more aggressive on having an entry price point item because that was a trend that we saw coming and trying to be proactive on addressing that, and we continue to add product in that. But for us, we're going to do everything we can to help a customer be able to have a great meal without compromising and eating as a family. And so far, the changes the customer is experiencing, we're making changes to trying to support the customer and the customer is connecting well with that. So you feel for people in terms of where they are, and we're going to do everything we can to try to help support them on what their particular situation is.
Operator: Thank you. Our next question comes from Robert Ohmes of Bank of America. Your line is now open. Please go ahead.
Robert Ohmes: Thanks for taking my question. Maybe, Todd, for you, can we get even -- you gave some color already on the OG&A line for the back half. Maybe a little more how -- where is Kroger on the wage pressure in the back half of the year, say versus the front half? And also, you guys called out general liability claims. You're not the only retailer to call that out this quarter. If we get some -- how much pressure was that in the second quarter and is that an issue or a pressure in the back half? Thanks.
Todd Foley: Yes. No, great call out. Relative to second half OG&A again, given what we saw in the second quarter, our guidance on the year is now we will be slightly unfavorable to where we were a year ago. But beyond that, I think our trends will be as expected in the second half of the year. You talk about wage pressure. One thing to keep in mind on our wage pressure is because so many of our wages come through collective bargaining agreements, we've got 300 or so of those. But at any point in time, probably 75% of our wages are locked in, in a collective bargaining agreement. We have maybe a third or a quarter of those that are up each year that we constantly negotiate. So the guidance that we have out there reflects those expectations and where we're at from a wage perspective because most of those are known to us going into the year. Your comment on GL claims, there's really two pieces to general liability. The incident rate piece is -- actually our results are phenomenal. When you look at it through the lens of OSHA incident rates, we're very much below where the industry averages are at. And even as a company where we're at, we're in that kind of record low territory there, at least in modern history. And so we're extremely excited about the work that the teams do to manage the incidents from that standpoint and the number of claims. What we saw as we were going through our analysis this time was around the average cost of the claim, and what we were seeing relative to the cost to settle some of these claims being much higher. Given the environment that's out there, we're seeing more and more pressure on the average cost to settle those claims. And so as we evaluated what we had outstanding for reserves in that space, given that trend, we thought it was wise to update it. We have done a nice job in the past trying to mitigating those claims and have a variety of strategies to put into place, and we'll continue to be able to put more of those types of items in place to be more effective in keeping that average cost down. But I think the announces that we did, I think, has us comfortable with where we need to be now and we don't expect that to recur in the back half of the year.
Rodney McMullen: One other comment I would add to -- Robbie, to the OG&A comment that Todd was talking about is, we feel like we've developed a good skill on being able to identify cost reductions over time. And we would expect that's a skill that we'll have also as you look out in the second half and forward in next year as well. The other thing that our teams have done a nice job on is continuing to find process changes to be able to operate a store with less labor and simplify the store to run. And it's one of those where we've made good progress, but we still think we have plenty of opportunity to get better going forward. So I really appreciate the question.
Operator: Thank you. Our next question comes from Chuck Cerankosky from Northcoast Research. Your line is now open. Please go ahead.
Chuck Cerankosky: Good morning, everyone.
Rodney McMullen: Good morning.
Chuck Cerankosky: Rodney, when you look at the sales growth challenges, you mentioned the economic factors putting pressure on consumers, and it seems to be a wide range of consumers. But you also have nontraditional competitors put pressure on the supermarket channel. Can you sort of compare what the strengths of those difficult headwinds are as you're trying to accelerate sales at Kroger?
Rodney McMullen: Yeah, the increase in non-traditional competitors, obviously, has been a 20-year trend. And when you look at Amazon and Costco and Walmart and I could go on and on for the litany, those in terms of how do you be successful against them really is how do you continue to change your basic offering to the customer and supporting the customers' changes. And we felt good about those changes that we've made, but we still need to continue to make them. And it's one of those things where, if you ever think you've figured it out, it's -- I would say that it's not good, you need to change. So we feel good about our ability to compete. We'll have to continually change. It's the reason why we've invested so much in staying connected with the customer on a seamless perspective, continuing to invest in wages, continuing to invest in promotion, but making up some of those things with alternative profit growth and mix. And over time, we would hope food away -- a more stronger competitor on food away from home because half of the money that's spent on food is food away from home. And we see no reason why we shouldn't be able to get a share of that. If you look at the economic pressure so far, we feel confident in our ability to deal with it or manage it or whatever because there's -- fortunately, we have a large business, and there's a lot of moving parts. And Our Brands obviously had a strong quarter. We think the opportunity is even stronger in Our Brands and things like that, which helps support the customer that's under that economic pressure as well. So on those so far, I mean, if you had a depression, I wouldn't -- I would give a different answer. But so far on the things that we're seeing, we feel comfortable or confident in our ability to deal with those changes. Thanks Chuck.
Operator: Thank you. Our next question comes from Joe Feldman from Telsey Advisory Group. Your line is now open. Please go ahead.
Joe Feldman: Hi, good morning, guys. Thanks for taking the question.
Rodney McMullen: Good morning.
Joe Feldman: I wanted to ask about inventory level, which was down a little bit and down, I think, almost 3%, which is really good shape. I'm wondering how you guys are thinking about inventory going forward? And what drove that? Was it you guys -- is it fewer units? Is it because the prices have just come down a bit year-over-year, so you've been able to be lower inventory levels because of that? Maybe you could just share a little more color around that going forward.
Todd Foley: Yes. Great question, Joe. And I think you hit on some of the keys. I think it's a variety of things. Inventory, it's -- part of it is we're seeing less cost inflation, so the average cost of an item on the shelf is a little bit less. But we have also been very laser-focused relative to working capital and working capital management. When we talk about our strong cash flow generation, that's an important part of that is balancing our working capital. And it's -- both of those go together. It's always having the right tension between making sure we're in stock for our customers and having what our customers need, but making sure we don't have too much there so that we're being a good steward of working capital. So I think what you're seeing on the balance sheet is the combination of lower cost per item, relative inflation year-over-year and the right level of working capital management to make sure we're in stock for our customers.
Operator: Thank you. At this time, we will take no further questions for today, so I'll hand back to Rodney for any further remarks.
Rodney McMullen: Thanks, Alex and thank you to all for all your questions. And as you know, before we conclude our call, we always like to -- we have many of our associates listening in, and we always like to share a couple of comments with them. And I'd like to take a moment to acknowledge our 2024 Kroger Scholars. Since the Kroger Scholars Program was launched in 2008, we've awarded more than 3,300 scholarships, totaling almost $5 million to children of our associates. These recipients were selected based on a broad range of criteria, including their volunteering activities, civic service, extracurricular activities, academic performance and work experience. And it's always fun to be able to help a little on their education and congratulations to our 120 winners this year. And thanks to everyone for joining us today. And I know it's early, but it will be December before we talk to everyone. I hope everyone has a beginning, great holiday season as well, and thank you very much.
Operator: Thank you all for joining today's call. You may now disconnect your lines.
Subscribe now to gain full access to the earnings summary, 5 years analyst estimates and more exclusive content.
Subscribe NowWARNING: AI-generated summary.
While this is a phenomenal tool that can save you time and provide meaningful insights and key takeaways from the earnings call, it may contain inaccuracies or misinterpretations. For precise information, please refer to the original transcript.
(* All numbers are in thousands)
Fiscal Year | 2014 | 2015 | 2016 | 2017 | 2018 | 2019 | 2020 | 2021 | 2022 | 2023 |
---|---|---|---|---|---|---|---|---|---|---|
Revenue | 108,465,000 | 109,830,000 | 115,337,000 | 122,662,000 | 121,162,000 | 122,286,000 | 132,498,000 | 137,888,000 | 148,258,000 | 150,039,000 |
Cost Of Revenue | 85,512,000 | 85,496,000 | 89,502,000 | 95,662,000 | 94,894,000 | 95,294,000 | 101,597,000 | 107,539,000 | 116,480,000 | 119,800,000 |
Gross Profit | 22,953,000 | 24,334,000 | 25,835,000 | 27,000,000 | 26,268,000 | 26,992,000 | 30,901,000 | 30,349,000 | 31,778,000 | 30,239,000 |
Research And Development Expenses | 0 | 0 | 0 | 0 | 0 | 0 | 0 | 0 | 0 | 0 |
General And Administrative Expenses | 707,000 | 723,000 | 881,000 | 911,000 | 21,189,000 | 884,000 | 874,000 | 24,048,000 | 24,687,000 | 861,000 |
Selling And Marketing Expenses | 648,000 | 679,000 | 717,000 | 707,000 | 752,000 | 854,000 | 888,000 | 984,000 | 1,030,000 | 24,397,000 |
Selling General And Administrative Expenses | 707,000 | 723,000 | 881,000 | 911,000 | 21,189,000 | 884,000 | 874,000 | 24,048,000 | 24,687,000 | 25,258,000 |
Other Expenses | 1,948,000 | 2,089,000 | 2,340,000 | 2,436,000 | 2,465,000 | 23,857,000 | 27,247,000 | 2,824,000 | 2,965,000 | 30,000 |
Operating Expenses | 19,816,000 | 20,758,000 | 22,399,000 | 24,915,000 | 23,654,000 | 24,741,000 | 28,121,000 | 26,872,000 | 27,652,000 | 25,258,000 |
Cost And Expenses | 105,328,000 | 106,254,000 | 111,901,000 | 120,577,000 | 118,548,000 | 120,035,000 | 129,718,000 | 134,411,000 | 144,132,000 | 145,058,000 |
Interest Income | 0 | 0 | 0 | 0 | 0 | 603,000 | 544,000 | 571,000 | 535,000 | 0 |
Interest Expense | 488,000 | 482,000 | 522,000 | 601,000 | 620,000 | 603,000 | 544,000 | 571,000 | 535,000 | 441,000 |
Depreciation And Amortization | 1,948,000 | 2,089,000 | 2,340,000 | 2,436,000 | 2,465,000 | 3,289,000 | 3,373,000 | 3,429,000 | 3,579,000 | 3,750,000 |
EBITDA | 5,085,000 | 5,665,000 | 5,776,000 | 4,521,000 | 5,053,000 | 5,207,000 | 6,182,000 | 6,872,000 | 7,744,000 | 8,731,000 |
Operating Income | 3,137,000 | 3,576,000 | 3,436,000 | 2,085,000 | 2,614,000 | 2,251,000 | 2,780,000 | 3,477,000 | 4,126,000 | 4,981,000 |
Total Other Income Expenses Net | -488,000 | -482,000 | -522,000 | -601,000 | 1,364,000 | -270,000 | 590,000 | -1,426,000 | -1,224,000 | -2,145,000 |
income Before Tax | 2,649,000 | 3,094,000 | 2,914,000 | 1,484,000 | 3,978,000 | 1,981,000 | 3,370,000 | 2,051,000 | 2,902,000 | 2,836,000 |
Income Tax Expense | 902,000 | 1,045,000 | 957,000 | -405,000 | 900,000 | 469,000 | 782,000 | 385,000 | 653,000 | 667,000 |
Net Income | 1,728,000 | 2,039,000 | 1,975,000 | 1,907,000 | 3,110,000 | 1,659,000 | 2,585,000 | 1,655,000 | 2,244,000 | 2,164,000 |
Eps | 1.750 | 2.090 | 2.080 | 2.110 | 3.840 | 2.050 | 3.310 | 2.200 | 3.100 | 2.990 |
Eps Diluted | 1.720 | 2.060 | 2.050 | 2.090 | 3.800 | 2.040 | 3.270 | 2.170 | 3.060 | 2.960 |
Weighted Average Shares Outstanding | 980,000 | 966,000 | 942,000 | 895,000 | 810,000 | 799,000 | 773,000 | 744,000 | 718,000 | 718,000 |
Weighted Average Shares Outstanding Diluted | 994,000 | 980,000 | 958,000 | 904,000 | 818,000 | 805,000 | 781,000 | 754,000 | 727,000 | 725,000 |
Currency | USD | USD | USD | USD | USD | USD | USD | USD | USD | USD |
(* All numbers are in thousands)
Fiscal Year | 2014 | 2015 | 2016 | 2017 | 2018 | 2019 | 2020 | 2021 | 2022 | 2023 |
---|---|---|---|---|---|---|---|---|---|---|
Cash And Cash Equivalents | 268,000 | 277,000 | 322,000 | 347,000 | 429,000 | 399,000 | 1,687,000 | 1,821,000 | 828,000 | 1,883,000 |
Short Term Investments | 988,000 | 923,000 | 910,000 | 1,161,000 | 1,181,000 | 1,179,000 | 1,096,000 | 1,082,000 | 1,227,000 | 1,215,000 |
Cash And Short Term Investments | 1,256,000 | 1,200,000 | 1,232,000 | 1,508,000 | 1,610,000 | 1,578,000 | 2,783,000 | 2,903,000 | 2,055,000 | 3,098,000 |
Net Receivables | 1,266,000 | 1,734,000 | 1,649,000 | 1,637,000 | 1,589,000 | 1,692,000 | 1,756,000 | 1,828,000 | 2,234,000 | 2,136,000 |
Inventory | 5,688,000 | 6,168,000 | 6,561,000 | 6,533,000 | 6,846,000 | 7,084,000 | 7,063,000 | 6,783,000 | 7,560,000 | 7,105,000 |
Other Current Assets | 701,000 | 790,000 | 898,000 | 1,439,000 | 758,000 | 522,000 | 876,000 | 660,000 | 735,000 | 609,000 |
Total Current Assets | 8,911,000 | 9,892,000 | 10,340,000 | 11,148,000 | 10,803,000 | 10,876,000 | 12,478,000 | 12,174,000 | 12,584,000 | 12,948,000 |
Property Plant Equipment Net | 17,912,000 | 19,619,000 | 21,016,000 | 21,071,000 | 21,635,000 | 28,607,000 | 29,182,000 | 30,484,000 | 31,388,000 | 31,922,000 |
Goodwill | 2,304,000 | 2,724,000 | 3,031,000 | 2,925,000 | 3,087,000 | 3,076,000 | 3,076,000 | 3,076,000 | 2,916,000 | 2,916,000 |
Intangible Assets | 757,000 | 1,053,000 | 1,153,000 | 1,100,000 | 1,258,000 | 1,066,000 | 997,000 | 942,000 | 899,000 | 899,000 |
Goodwill And Intangible Assets | 3,061,000 | 3,777,000 | 4,184,000 | 4,025,000 | 4,345,000 | 4,142,000 | 4,073,000 | 4,018,000 | 3,815,000 | 3,815,000 |
Long Term Investments | -287,000 | -1,752,000 | -1,927,000 | -1,568,000 | -1,562,000 | -1,466,000 | -1,542,000 | -1,562,000 | 489,000 | 170,000 |
Tax Assets | 287,000 | 1,752,000 | 1,927,000 | 1,568,000 | 1,562,000 | 1,466,000 | 1,542,000 | 1,562,000 | 1,562,000 | 1,579,000 |
Other Non Current Assets | 672,000 | 609,000 | 965,000 | 984,000 | 1,335,000 | 1,539,000 | 2,904,000 | 2,410,000 | -301,000 | 71,000 |
Total Non Current Assets | 21,645,000 | 24,005,000 | 26,165,000 | 26,080,000 | 27,315,000 | 34,288,000 | 36,159,000 | 36,912,000 | 36,953,000 | 37,557,000 |
Other Assets | 0 | 0 | 0 | 0 | 0 | 0 | 0 | 0 | 0 | 0 |
Total Assets | 30,556,000 | 33,897,000 | 36,505,000 | 37,228,000 | 38,118,000 | 45,164,000 | 48,637,000 | 49,086,000 | 49,537,000 | 50,505,000 |
Account Payables | 5,052,000 | 5,728,000 | 5,818,000 | 5,858,000 | 6,059,000 | 6,349,000 | 6,679,000 | 7,117,000 | 7,119,000 | 10,381,000 |
Short Term Debt | 1,885,000 | 2,370,000 | 2,252,000 | 3,560,000 | 3,157,000 | 2,537,000 | 1,578,000 | 1,205,000 | 1,469,000 | 868,000 |
Tax Payables | 0 | 221,000 | 251,000 | 1,000 | 60,000 | 0 | 0 | 0 | 0 | 0 |
Deferred Revenue | 1,578,000 | 221,000 | 251,000 | 1,568,000 | 1,562,000 | 1,168,000 | 1,413,000 | 0 | 0 | 0 |
Other Current Liabilities | 2,888,000 | 4,666,000 | 4,539,000 | 3,243,000 | 3,496,000 | 4,086,000 | 5,700,000 | 8,001,000 | 8,061,000 | 4,809,000 |
Total Current Liabilities | 11,403,000 | 12,985,000 | 12,860,000 | 14,229,000 | 14,274,000 | 14,140,000 | 15,370,000 | 16,323,000 | 16,649,000 | 16,058,000 |
Long Term Debt | 9,771,000 | 9,709,000 | 11,825,000 | 12,029,000 | 12,072,000 | 18,641,000 | 19,009,000 | 19,235,000 | 18,943,000 | 10,162,000 |
Deferred Revenue Non Current | 1,463,000 | 1,380,000 | 1,524,000 | 792,000 | 494,000 | 608,000 | 535,000 | 0 | 0 | 6,351,000 |
Deferred Tax Liabilities Non Current | 1,209,000 | 1,733,000 | 1,927,000 | 1,585,000 | 1,574,000 | 1,452,000 | 1,513,000 | 1,562,000 | 1,672,000 | 1,579,000 |
Other Non Current Liabilities | 1,268,000 | 1,301,000 | 1,659,000 | 1,688,000 | 1,869,000 | 1,750,000 | 2,660,000 | 2,537,000 | 2,259,000 | 4,754,000 |
Total Non Current Liabilities | 13,711,000 | 14,123,000 | 16,935,000 | 16,094,000 | 16,009,000 | 22,451,000 | 23,717,000 | 23,334,000 | 22,874,000 | 22,846,000 |
Other Liabilities | 0 | 0 | 0 | 0 | 0 | 0 | 0 | 0 | 0 | 0 |
Capital Lease Obligations | 9,771,000 | 9,709,000 | 707,000 | 824,000 | 824,000 | 7,102,000 | 7,174,000 | 7,076,000 | 7,034,000 | 8,217,000 |
Total Liabilities | 25,114,000 | 27,108,000 | 29,795,000 | 30,323,000 | 30,283,000 | 36,591,000 | 39,087,000 | 39,657,000 | 39,523,000 | 38,904,000 |
Preferred Stock | 30,000 | 0 | 12,000 | 0 | 0 | 0 | 0 | 0 | 0 | 0 |
Common Stock | 959,000 | 1,918,000 | 1,918,000 | 1,918,000 | 1,918,000 | 1,918,000 | 1,918,000 | 1,918,000 | 1,918,000 | 1,918,000 |
Retained Earnings | 12,367,000 | 14,011,000 | 15,543,000 | 17,007,000 | 19,681,000 | 20,978,000 | 23,018,000 | 24,066,000 | 25,601,000 | 26,946,000 |
Accumulated Other Comprehensive Income Loss | -812,000 | -680,000 | -715,000 | -471,000 | -346,000 | -640,000 | -630,000 | -467,000 | -632,000 | -489,000 |
Other Total Stockholders Equity | -7,102,000 | -8,460,000 | -10,048,000 | -11,549,000 | -13,418,000 | -13,683,000 | -14,756,000 | -16,088,000 | -16,873,000 | -16,760,000 |
Total Stockholders Equity | 5,442,000 | 6,789,000 | 6,710,000 | 6,905,000 | 7,835,000 | 8,573,000 | 9,550,000 | 9,429,000 | 10,014,000 | 11,615,000 |
Total Equity | 5,472,000 | 6,767,000 | 6,722,000 | 6,879,000 | 7,784,000 | 8,544,000 | 9,524,000 | 9,406,000 | 9,986,000 | 11,601,000 |
Total Liabilities And Stockholders Equity | 30,556,000 | 33,897,000 | 36,505,000 | 37,228,000 | 38,118,000 | 45,164,000 | 48,637,000 | 49,086,000 | 49,537,000 | 50,505,000 |
Minority Interest | 30,000 | -22,000 | 12,000 | -26,000 | -51,000 | -29,000 | -26,000 | -23,000 | -28,000 | -14,000 |
Total Liabilities And Total Equity | 30,556,000 | 33,897,000 | 36,505,000 | 37,228,000 | 38,118,000 | 45,164,000 | 48,637,000 | 49,086,000 | 49,537,000 | 50,505,000 |
Total Investments | 988,000 | 923,000 | 910,000 | 1,161,000 | 1,181,000 | 1,179,000 | 1,096,000 | 1,082,000 | 1,227,000 | 1,385,000 |
Total Debt | 11,656,000 | 12,079,000 | 14,077,000 | 15,589,000 | 15,229,000 | 21,178,000 | 20,587,000 | 20,440,000 | 20,412,000 | 19,247,000 |
Net Debt | 11,388,000 | 11,802,000 | 13,755,000 | 15,242,000 | 14,800,000 | 20,779,000 | 18,900,000 | 18,619,000 | 19,584,000 | 17,364,000 |
Currency | USD | USD | USD | USD | USD | USD | USD | USD | USD | USD |
(* All numbers are in thousands)
Fiscal Year | 2014 | 2015 | 2016 | 2017 | 2018 | 2019 | 2020 | 2021 | 2022 | 2023 |
---|---|---|---|---|---|---|---|---|---|---|
Net Income | 1,747,000 | 2,049,000 | 1,957,000 | 1,889,000 | 3,078,000 | 1,512,000 | 2,588,000 | 1,666,000 | 2,249,000 | 2,146,000 |
Depreciation And Amortization | 1,948,000 | 2,089,000 | 2,340,000 | 2,436,000 | 2,465,000 | 3,289,000 | 3,373,000 | 3,429,000 | 3,579,000 | 3,750,000 |
Deferred Income Tax | 73,000 | 317,000 | 201,000 | -677,000 | -33,000 | -71,000 | 44,000 | -31,000 | 161,000 | -155,000 |
Stock Based Compensation | 155,000 | 165,000 | 141,000 | 151,000 | 154,000 | 155,000 | 185,000 | 203,000 | 190,000 | 172,000 |
Change In Working Capital | -49,000 | -18,000 | -478,000 | -158,000 | 474,000 | -592,000 | 1,570,000 | -229,000 | -3,379,000 | 896,000 |
Accounts Receivables | 42,000 | 199,000 | -387,000 | -235,000 | 432,000 | -403,000 | 481,000 | -61,000 | -222,000 | 14,000 |
Inventory | -147,000 | -184,000 | -382,000 | -23,000 | -354,000 | -351,000 | 7,000 | 80,000 | -1,370,000 | 342,000 |
Accounts Payables | 146,000 | 440,000 | 16,000 | 190,000 | 213,000 | 342,000 | 330,000 | 438,000 | 3,000 | 545,000 |
Other Working Capital | -90,000 | -473,000 | 275,000 | -90,000 | 183,000 | -180,000 | 752,000 | -686,000 | -1,790,000 | -5,000 |
Other Non Cash Items | 311,000 | 244,000 | 111,000 | -228,000 | -1,974,000 | 371,000 | -945,000 | 1,152,000 | 1,511,000 | 67,000 |
Net Cash Provided By Operating Activities | 4,185,000 | 4,846,000 | 4,272,000 | 3,413,000 | 4,164,000 | 4,664,000 | 6,815,000 | 6,190,000 | 4,311,000 | 6,876,000 |
Investments In Property Plant And Equipment | -2,831,000 | -3,349,000 | -3,699,000 | -2,809,000 | -2,967,000 | -3,128,000 | -2,865,000 | -2,614,000 | -3,078,000 | -3,904,000 |
Acquisitions Net | -252,000 | -168,000 | -401,000 | -16,000 | 1,928,000 | 327,000 | 165,000 | 153,000 | 78,000 | 101,000 |
Purchases Of Investments | 0 | 0 | 0 | 0 | -392,000 | 0 | 0 | 0 | 0 | 0 |
Sales Maturities Of Investments | 0 | 0 | 0 | 0 | 235,000 | 0 | 0 | 0 | 0 | 0 |
Other Investing Activites | 23,000 | -53,000 | 225,000 | 118,000 | 10,000 | 190,000 | -114,000 | -150,000 | -15,000 | 53,000 |
Net Cash Used For Investing Activites | -3,060,000 | -3,570,000 | -3,875,000 | -2,707,000 | -1,186,000 | -2,611,000 | -2,814,000 | -2,611,000 | -3,015,000 | -3,750,000 |
Debt Repayment | -375,000 | -1,530,000 | -1,355,000 | -788,000 | -2,693,000 | -2,304,000 | -1,897,000 | -1,442,000 | -552,000 | -1,286,000 |
Common Stock Issued | 110,000 | 107,000 | 68,000 | 51,000 | 65,000 | 55,000 | 127,000 | 172,000 | 134,000 | 50,000 |
Common Stock Repurchased | -1,283,000 | -703,000 | -1,766,000 | -1,633,000 | -2,010,000 | -465,000 | -1,324,000 | -1,647,000 | -993,000 | -62,000 |
Dividends Paid | -338,000 | -385,000 | -429,000 | -443,000 | -437,000 | -486,000 | -534,000 | -589,000 | -682,000 | -796,000 |
Other Financing Activites | 628,000 | 1,244,000 | 3,130,000 | 2,132,000 | 2,179,000 | 1,117,000 | 915,000 | 61,000 | -196,000 | -76,000 |
Net Cash Used Provided By Financing Activities | -1,258,000 | -1,267,000 | -352,000 | -681,000 | -2,896,000 | -2,083,000 | -2,713,000 | -3,445,000 | -2,289,000 | -2,170,000 |
Effect Of Forex Changes On Cash | 0 | 0 | 0 | 0 | 0 | 0 | 0 | 0 | 0 | -107,000 |
Net Change In Cash | -133,000 | 9,000 | 45,000 | 25,000 | 82,000 | -30,000 | 1,288,000 | 134,000 | -993,000 | 868,000 |
Cash At End Of Period | 268,000 | 277,000 | 322,000 | 347,000 | 429,000 | 399,000 | 1,687,000 | 1,821,000 | 828,000 | 1,883,000 |
Cash At Beginning Of Period | 401,000 | 268,000 | 277,000 | 322,000 | 347,000 | 429,000 | 399,000 | 1,687,000 | 1,821,000 | 1,015,000 |
Operating Cash Flow | 4,185,000 | 4,846,000 | 4,272,000 | 3,413,000 | 4,164,000 | 4,664,000 | 6,815,000 | 6,190,000 | 4,311,000 | 6,876,000 |
Capital Expenditure | -2,831,000 | -3,349,000 | -3,699,000 | -2,809,000 | -2,967,000 | -3,128,000 | -2,865,000 | -2,614,000 | -3,078,000 | -3,904,000 |
Free Cash Flow | 1,354,000 | 1,497,000 | 573,000 | 604,000 | 1,197,000 | 1,536,000 | 3,950,000 | 3,576,000 | 1,233,000 | 2,972,000 |
Currency | USD | USD | USD | USD | USD | USD | USD | USD | USD | USD |
(* All numbers are in thousands)
Revenue (TTM) : | P/S (TTM) : | 0.29 | ||
Net Income (TTM) : | P/E (TTM) : | 15.56 | ||
Enterprise Value (TTM) : | 60.113B | EV/FCF (TTM) : | 33.62 | |
Dividend Yield (TTM) : | 0.02 | Payout Ratio (TTM) : | 0.3 | |
ROE (TTM) : | 0.23 | ROIC (TTM) : | 0.15 | |
SG&A/Revenue (TTM) : | 0.05 | R&D/Revenue (TTM) : | 0 | |
Net Debt (TTM) : | 150.039B | Debt/Equity (TTM) | 0.88 | P/B (TTM) : | 3.47 | Current Ratio (TTM) : | 0.87 |
Trading Metrics:
Open: | 60.41 | Previous Close: | 60.15 | |
Day Low: | 59.35 | Day High: | 60.6 | |
Year Low: | 43.51 | Year High: | 61.18 | |
Price Avg 50: | 57.41 | Price Avg 200: | 54.44 | |
Volume: | 1.492M | Average Volume: | 3.784M |