



MARKETSnap
  • Market Snapshots
    • Gainers & Losers
    • Most Active & More
    • 52-Week High/Low
    • Dividends
    • P/E Ratios
      • Large Caps
      • Absolute
      • Total Market PE
    • Stocks Performance
      • Large Caps
      • Absolute
    • Industries Performance
      • Industry
      • Sector
  • Analyze Stock
    • Analyze a stockAnalyze KMB →
    • FindStock Picks / Stock Screener
    • Value · KMBIntrinsic Value Calculator
    • Invest · KMBInvestment Case
    • Hold · KMB5-Year Outlook
  • Learn
  • Calendar
  • Investment Compounding
    Calculator
  • Investing Philosophy
  • More
    • Charts
    • Commodities
    • Currencies
    • Economic Indicators
      • Inflation
      • Consumer Sentiment
      • Recession Probability
      • Treasury Rates
      • GDP
KMB stock logo

KMB

Kimberly-Clark Corporation

$110.57
6.11
 (5.85%)
Exchange:  NASDAQ
Market Cap:  36.773B
Shares Outstanding:  333.1M
Delayed data
Overview
Earnings
Financials
Valuation
Chart

About The Company

Sector:  Consumer DefensiveView sector performance
Industry:  Household & Personal ProductsView industry performance
   
CEO:  Michael D. Hsu
Full Time Employees:  36000
Address: 
PO Box 619100
Dallas
TX
75261-9100
US
Website:  https://www.kimberly-clark.com
Kimberly-Clark Corporation, together with its subsidiaries, manufactures and markets personal care products in the United States. It operates in two segments, North America and International Personal Care. The North America segment offers disposable diapers, training and youth pants, swimpants, baby wipes, feminine and incontinence care products, reusable underwear, facial and bathroom tissue, paper towels, napkins, wipers, tissue, towels, soaps and sanitizers, and other related products under the Huggies, Pull-Ups, Goodnites, Kotex, Poise, Depend, Kleenex, Scott, Cottonelle, Viva, Wypall , and other brand names. Its International Personal Care segment provides baby and child care, adult care and feminine care, including disposable diapers, training and youth pants, swimpants, baby wipes, feminine and incontinence care products, reusable underwear, and other related products under the Huggies, Kotex, Goodfeel, Intimus, Depend, and other brand names. The company sells its household use products directly to supermarkets, mass merchandisers, drugstores, warehouse clubs, variety and department stores, and other retail outlets, as well as through other distributors and e-commerce. It also sells its professional use products through distributors, directly to manufacturing, lodging, office building, food service, and high-volume public facilities, and through e-commerce. Kimberly-Clark Corporation was founded in 1872 and is headquartered in Dallas, Texas.

Click to read more…

Revenue Segmentation

Revenue by type

Revenue by region

Log in to continue

Log in to see the complete revenue and geographic breakdown.

Login — it's free

KMB full analysis

11/08/2025

Welcome to MARKETSNAP’s SWOT analysis for Kimberly-Clark Corporation, or KMB as it’s known on the ticker. If you’re a long-term investor looking to build wealth with solid, dependable stocks, you’re in the right place. Today, we’re diving deep into Kimberly-Clark, a heavyweight in the consumer goods space, to break down its strengths, weaknesses, opportunities, and threats. I’ll keep this conversational and packed with insights, so let’s get started with a quick overview before we dig into the nitty-gritty. Kimberly-Clark is…

Open MarketSnap Listen

Log in to continue

Log in to see the full analysis preview and audio links.

Login — it's free

Industry Peers

TICKERCOMPANYMKT CAPP/EFWD P/EROIC
KMKMB logoKMBKimberly-Clark Corporation36.8B18.415.012.5%
KVKVUE logoKVUEKenvue Inc.37.1B21.916.510.5%
ELEL logoELThe Estée Lauder Companies Inc.40.8B21446.24.1%
CHCHD logoCHDChurch & Dwight Co., Inc.26.8B32.929.911.1%
CLCLX logoCLXThe Clorox Company12.2B18.318.220.4%
ELELF logoELFe.l.f. Beauty, Inc.6.9B11237.86.1%

EPS

Historical EPS and analyst estimates in one chart. Log in for the full interactive view and links to detailed estimates.

Log in to continue

Log in for the full EPS chart and links to analyst estimates.

Login — it's free
View full analyst estimates

Earnings Call

Full text

Earnings transcript

Read the complete earnings call transcript.

AI summary

Key takeaways

Short, structured highlights from the call so you can focus on what matters.

2026/08/06 — 2 quarter 2026

Log in to continue

Log in to read the full transcript and AI-generated earnings summaries.

Login — it's free
Income Statement
Balance Sheet
Cash Flow Statement
Analyst Estimates

Income Statement

Year202320242025
Revenue20,431,00020,058,00017,216,000
Gross Profit7,032,0007,180,0006,130,000
EBITDA3,067,0003,978,0003,296,000
Operating Income2,344,0003,210,0002,489,000
Net Income1,764,0002,545,0002,021,000

Log in to continue

Log in to see the income statement and 10 historical years.

Login — it's free

(* All numbers are in thousands)

Balance Sheet

Year202320242025
Total Assets17,344,00016,546,00017,226,000
Total Liabilities16,276,00015,571,00015,468,000
Total Stockholders Equity915,000840,0001,630,000
Total Debt8,114,0007,574,0007,168,000
Cash and Cash Equivalents1,093,0001,021,000688,000

Log in to continue

Log in to see the balance sheet and 10 historical years.

Login — it's free

(* All numbers are in thousands)

Cash Flow Statement

Year202320242025
Operating Cash Flow3,542,0003,234,0002,777,000
Capital Expenditure-766,000-721,0000
Free Cash Flow2,776,0002,513,0002,777,000
Net Income1,764,0002,578,0002,049,000
Net Change in Cash666,000-72,000-322,000

Log in to continue

Log in to see the cash flow statement and 10 historical years.

Login — it's free

(* All numbers are in thousands)

Analyst Estimates

Fiscal Year2030Research AccessResearch AccessResearch AccessResearch Access
Estimated Revenue (Low)35,406,242.028Research AccessResearch AccessResearch AccessResearch Access
Estimated Revenue (High)36,201,608.430Research AccessResearch AccessResearch AccessResearch Access
Estimated Revenue (Avg)35,843,189.409Research AccessResearch AccessResearch AccessResearch Access
Estimated Ebitda (Low)4,803,116.455Research AccessResearch AccessResearch AccessResearch Access
Estimated Ebitda (High)4,905,194.637Research AccessResearch AccessResearch AccessResearch Access
Estimated Ebitda (Avg)4,859,195.334Research AccessResearch AccessResearch AccessResearch Access
Estimated Net Income (Low)2,840,416.990Research AccessResearch AccessResearch AccessResearch Access
Estimated Net Income (High)2,923,672.004Research AccessResearch AccessResearch AccessResearch Access
Estimated Net Income (Avg)2,886,154.951Research AccessResearch AccessResearch AccessResearch Access
Estimated SGA Expense (Low)6,668,351.207Research AccessResearch AccessResearch AccessResearch Access
Estimated SGA Expense (High)6,818,149.158Research AccessResearch AccessResearch AccessResearch Access
Estimated SGA Expense (Avg)6,750,645.131Research AccessResearch AccessResearch AccessResearch Access
Estimated EPS (Avg)8.660Research AccessResearch AccessResearch AccessResearch Access
Estimated EPS (High)8.780Research AccessResearch AccessResearch AccessResearch Access
Estimated EPS (Low)8.530Research AccessResearch AccessResearch AccessResearch Access
Number of Analysts (Estimated Revenue)6Research AccessResearch AccessResearch AccessResearch Access
Number of Analysts (Estimated EPS)1Research AccessResearch AccessResearch AccessResearch Access

Log in to continue

Log in and subscribe to Full Access to see up to 5 years of analyst estimates.

Login — it's free

(* All numbers are in thousands)

Current Key Metrics

?Revenue
 (TTM)
: 
20.058B  ?P/S
 (TTM)
: 
2.17
?Net Income
 (TTM)
: 
2.545B  ?P/E
 (TTM)
: 
18.36
?Enterprise Value
 (TTM)
: 
41.46B  ?EV/FCF
 (TTM)
: 
16.19
?Dividend Yield
 (TTM)
: 
4.73%  ?Payout Ratio
 (TTM)
: 
85.88%
?ROE
 (TTM)
: 
122.57%  ?ROIC
 (TTM)
: 
12.46%
?Net Debt
 (TTM)
: 
6.672B  ?Debt/Equity
 (TTM)
: 
3.72
?P/B
 (TTM)
: 
20.51  ?Current Ratio
 (TTM)
: 
0.91

Log in to continue

Log in to see all key valuation metrics and ratios for this symbol.

Login — it's free

Forward P/E Ratios

?

Forward P/E (Avg EPS estimate) — log in with Research Access for high/low estimates and the interactive table.

Forward P/E 1YResearch AccessResearch AccessResearch AccessResearch Access
14.96Research AccessResearch AccessResearch AccessResearch Access

Log in to continue

Log in with Full Access for forward P/E high/low estimates and the full multi-year table.

Login — it's free

SWOT Analysis

Strengths (preview)

  • Strong Revenue Performance: KMB has demonstrated consistent revenue generation as per the latest income statements, supported by robust gross profit margins (grossProfitMarginTTM). This reflects the company’s ability to maintain pricing power and operational efficiency within the consumer goods sector.
  • Solid Dividend Yield: With a competitive dividend yield (dividendYieldTTM) and a history of consistent dividend payments (lastDiv), KMB offers an attractive income stream for investors, appealing to those focused on wealth-building through stable returns.
  • Healthy Cash Flow: Positive free cash flow (freeCashFlowYieldTTM and freeCashFlow from cash flow statements) indicates strong liquidity and the ability to fund operations, dividends, and potential investments without excessive reliance on external financing.
  • Market Position: As a key player in the consumer staples sector (sectorName), KMB benefits from a stable demand for essential products, evidenced by its market capitalization (mktCap) and long-standing presence in the industry.

Log in with Research Access for Weaknesses, Opportunities, Threats, and the complete SWOT.

Log in to continue

Log in with Full Access for the complete SWOT analysis.

Login — it's free

At what price to buy it? -
Intrinsic Value Calculator

Based on current fundamentals and analyst forecasts, MarketSnap estimates KMB intrinsic value between $120.11 – $129.28 per share. This depends on revenue growth, margins, and discount rate.

This is an automatic estimate. The most reliable way to know fair value for your own assumptions is to run the calculator below.


Calculate KMB Intrinsic Value

Common questions about KMB valuation

Is Kimberly-Clark Corporation (KMB) overvalued or undervalued right now?

MarketSnap estimates intrinsic value for Kimberly-Clark Corporation (KMB) using its proprietary valuation methodology, which incorporates discounted cash flow (DCF) analysis together with long-term earnings and fundamentals assumptions. By comparing intrinsic value to the current market price, long-term investors can see whether the stock screens as potentially overvalued, fairly valued, or undervalued today.

Is KMB a buy, hold, or sell for long-term investors?

MarketSnap does not give one-word “buy” or “sell” calls. Instead, it shows whether KMB trades at a premium or discount to its estimated intrinsic value, how sensitive that value is to growth and margin assumptions, and how the stock fits into a diversified, long-term portfolio so investors can make their own buy, hold, or sell decision.

What is KMB’s P/E ratio?

You can see KMB’s trailing P/E (TTM) and forward P/E estimates in the Current Key Metrics and Forward P/E Ratios sections above. The P/E ratio compares the current share price to earnings per share and helps investors gauge valuation relative to earnings.

How is intrinsic value calculated for KMB?

MarketSnap uses its own valuation framework—not a generic spreadsheet DCF alone. Future cash flows and earnings are projected, discounted, and combined with MarketSnap’s methodology so intrinsic value reflects fundamentals and long-term assumptions. You can run your own inputs and see the result using the Intrinsic Value Calculator above.

Is KMB a good long-term investment?

Whether KMB fits a long-term portfolio depends on your assumptions about growth, margins, and risk. MarketSnap provides the metrics, intrinsic value calculator, and SWOT context so you can form your own view rather than rely on a single buy/sell rating.

Research tools for Kimberly-Clark Corporation

  • Kimberly-Clark Corporation intrinsic value calculatorEstimate what the business is worth
  • Kimberly-Clark Corporation 5-year outlookWhat has to go right, and what could go wrong
KMB

1-day price chart preview. Log in for 1W through 5Y ranges and period tabs.

Daily snapshot

5.85
MarketSnap

Trading Metrics:

Open: 105.86   Previous Close: 104.46
Day Low: 105.32   Day High: 110.88
Year Low: 92.42   Year High: 116.82
Price Avg 50: 102.66   Price Avg 200: 103.06
Volume: 4.267M   Average Volume: 4.246M

Log in to continue

Log in for multi-period charts (1W–5Y), period tabs, and the same layout as members.

Login — it's free

See in Nexus

Relevant news

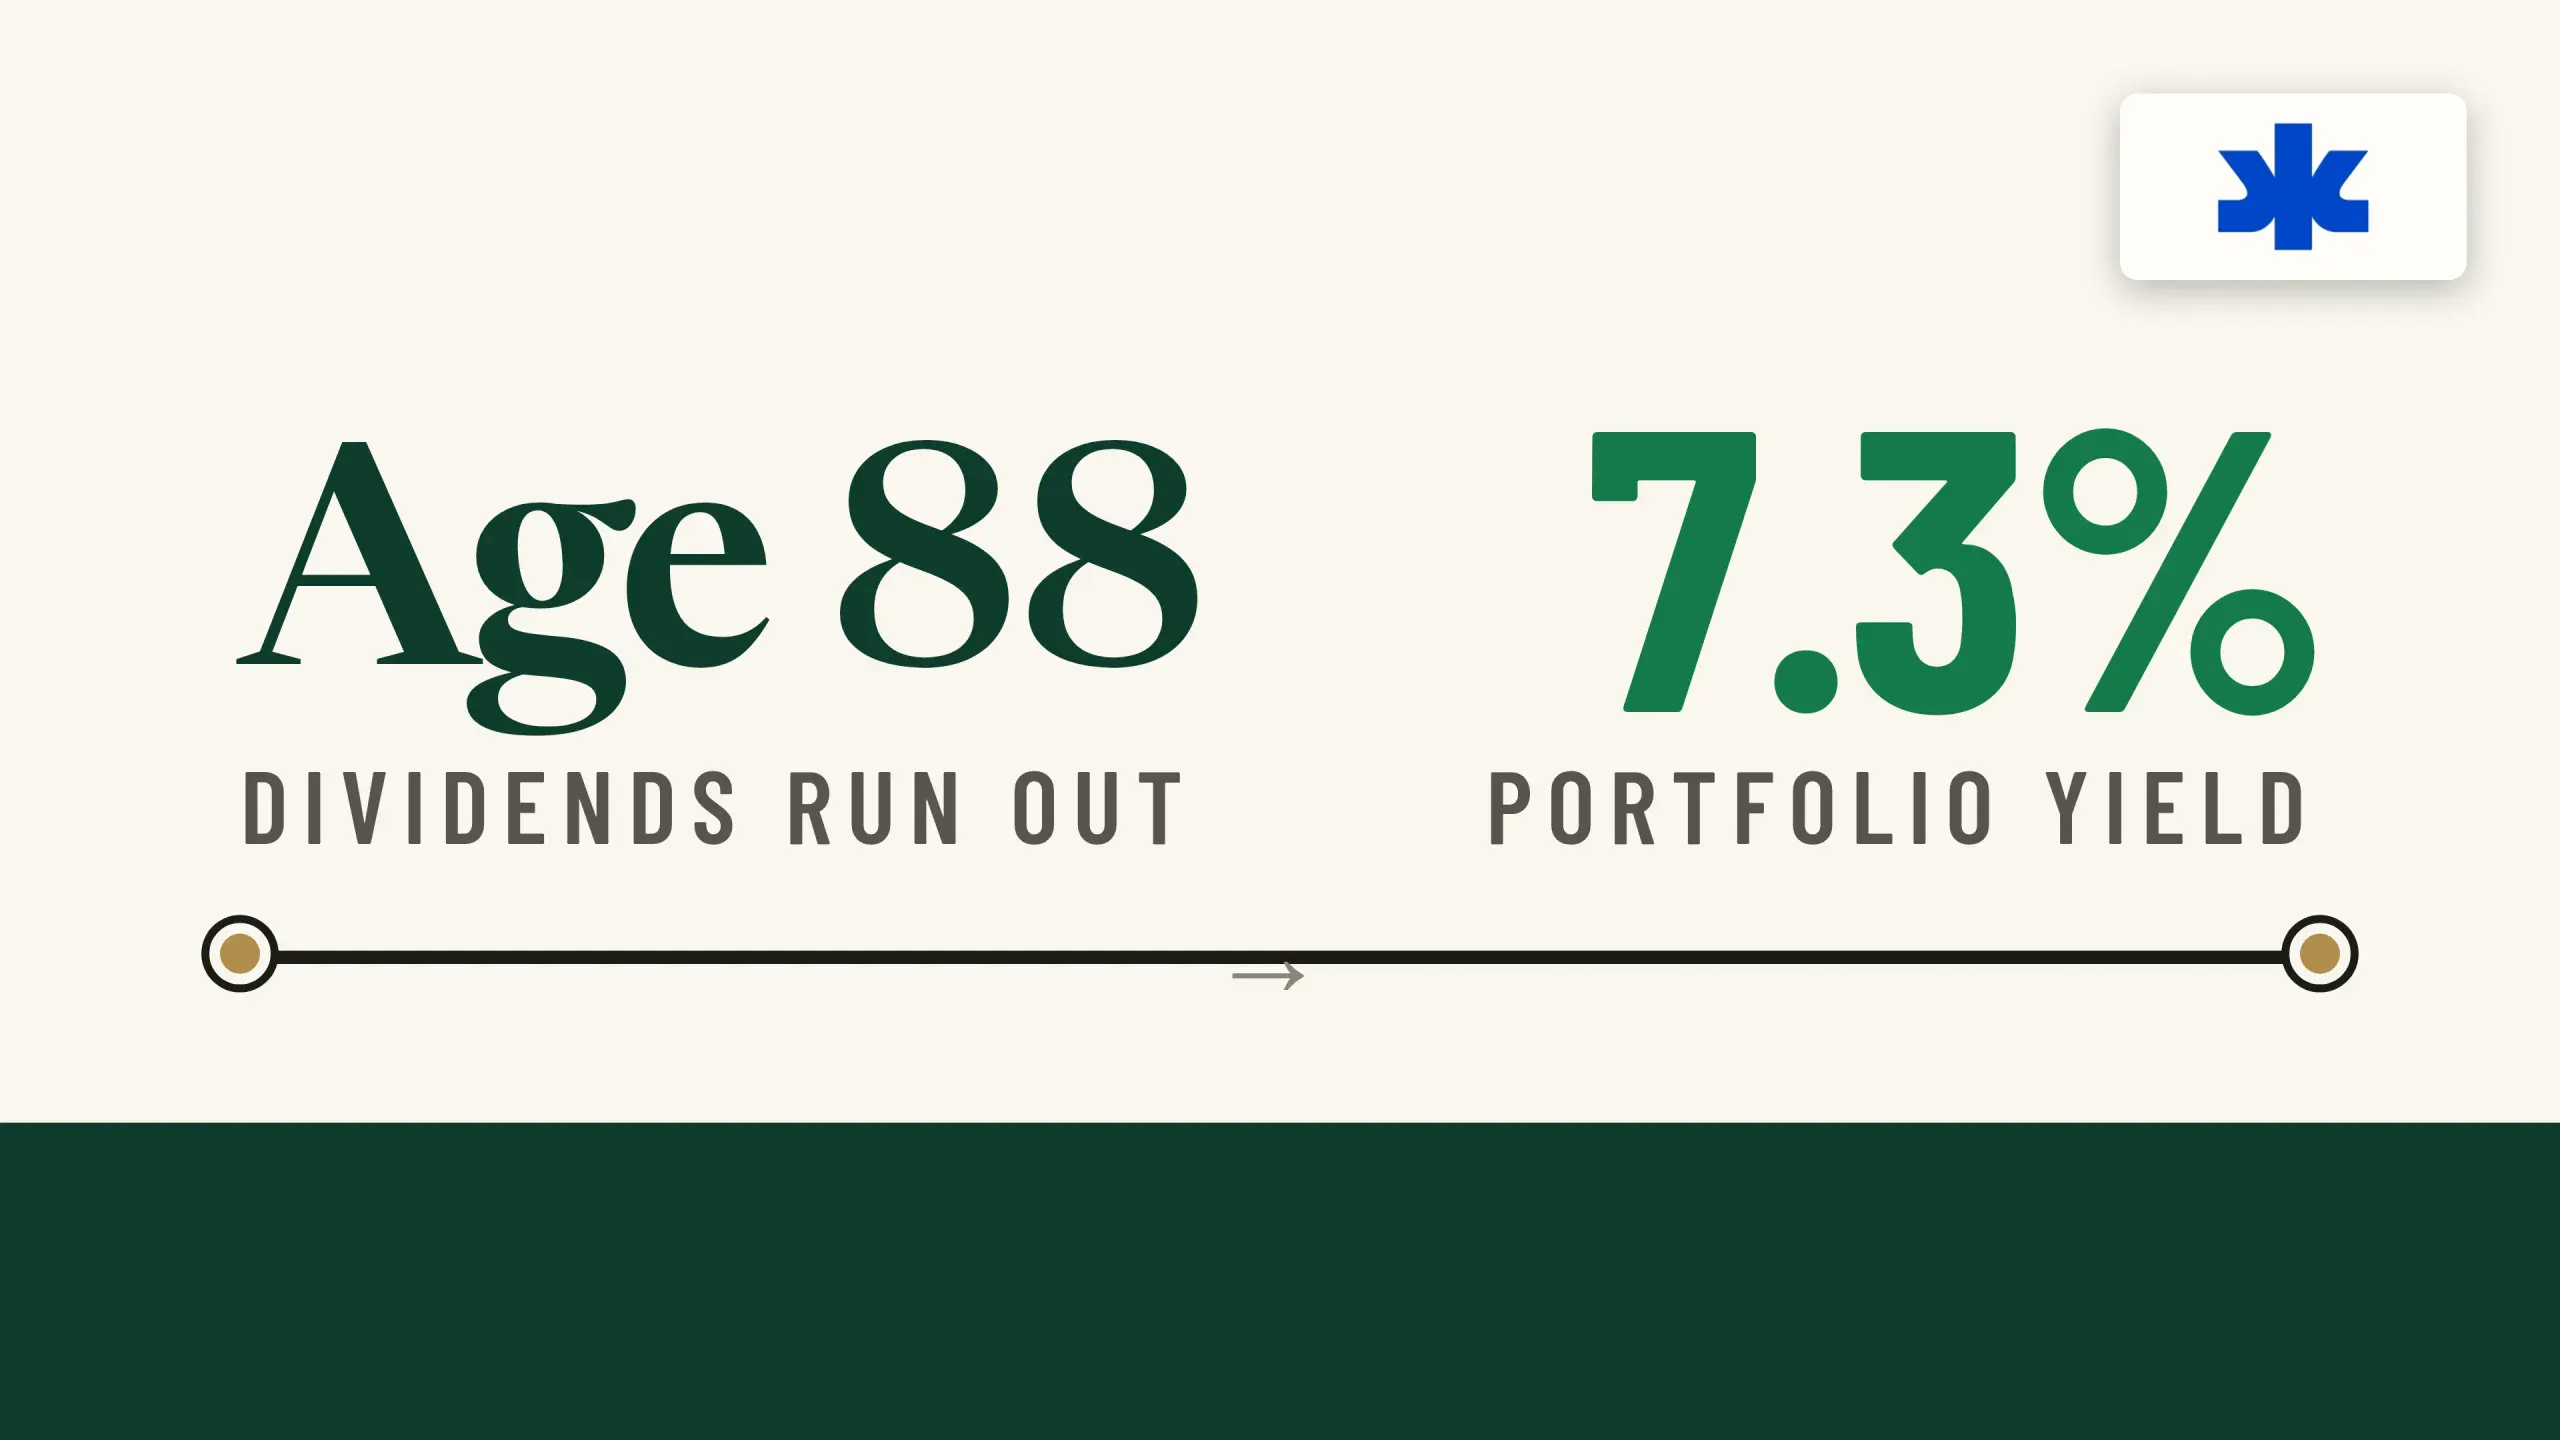
The Dividend Portfolio That Covers Your Required Minimum Distribution Without Selling a Share: KMB, BIZD, and SPHD
03-11-2026 14:14
The Dividend Portfolio That Covers Your Required Minimum Distribution Without Selling a Share: KMB, BIZD, and SPHD
Gear Up for Kimberly-Clark (KMB) Q3 Earnings: Wall Street Estimates for Key Metrics
03-11-2026 10:16
Gear Up for Kimberly-Clark (KMB) Q3 Earnings: Wall Street Estimates for Key Metrics
Kimberly-Clark Corporation Announces Successful Completion of $4.9 Billion Private Offering of Senior Notes
29-10-2026 17:10
Kimberly-Clark Corporation Announces Successful Completion of $4.9 Billion Private Offering of Senior Notes
Kimberly-Clark vs. Coca-Cola: Which Dividend Stock Is the Better Buy Now?
22-10-2026 20:55
Kimberly-Clark vs. Coca-Cola: Which Dividend Stock Is the Better Buy Now?
Jim Cramer Calls Kimberly-Clark a Hated Dividend King. Is He Right?
21-10-2026 17:00
Jim Cramer Calls Kimberly-Clark a Hated Dividend King. Is He Right?
4 Stocks To Watch This Earnings Season Beyond Big Tech And AI
19-10-2026 14:20
4 Stocks To Watch This Earnings Season Beyond Big Tech And AI

DISCLAIMER: The stock market data provided on this website is for informational purposes only and is not intended for trading purposes. While we strive to provide accurate and timely information, we cannot guarantee that the information is accurate at the moment it is received or that it will continue to be accurate in the future. We are not responsible for any actions taken based on the information provided on this website. Always consult with a licensed financial professional before making any investment decisions.
Terms of Service

Copyright © 2025 MarketSnap. All rights reserved.

Contact Us

Privacy Policy

Cookie Policy

Terms of Service

Hover Image
MARKETSnap

Market

🇺🇸 United States

Language

    • Gainers & Losers
    • Most Active & More
    • 52-Week High/Low
    • Dividends
      • Large Caps
      • Absolute
      • Total Market PE
      • Large Caps
      • Absolute
      • Industry
      • Sector
    • Analyze a stockAnalyze KMB →
    • FindStock Picks / Stock Screener
    • Value · KMBIntrinsic Value Calculator
    • Invest · KMBInvestment Case
    • Hold · KMB5-Year Outlook
  • Learn
  • Calendar
  • Investment Compounding Calculator
    • Charts
    • Commodities
    • Currencies
      • Inflation
      • Consumer Sentiment
      • Recession Probability
      • Treasury Rates
      • GDP
  • Investing Philosophy
  • Nexus
    • Recent Activity
      • Overview
      • My Valuations
      • My Investment Journal
      • Watchlists & Portfolio
    • Settings
    • Public profile ↗
  • Log in

Media

Watch Listen Read